
SIMULATION OF RADIONUCLIDES TRANSPORT AROUND
TRIGA REACTOR SITE
Won-Zin Oh, Hui-Jun Won, Byung-Jik Lee, Gye-Nam Kim
Korea Atomic Energy Research Institute
ABSTRACT
The simulation of the underground, long-term radionuclides migration around the TRIGA reactor site was studied to release the site to the unlimited reuse after TRIGA reactor decommissioning. The soil within the study area was sampled and its hydraulic conductivity, porosity, moisture content, and distribution coefficient were measured at the laboratory. Results simulating the area around the TRIGA reactor are (1) the section influenced most critically by the residual radionuclides is the 150 m distance between the reactor building and a front stream, (2) an average flow velocity of groundwater around the TRIGA reactor is 0.6~ 1.8 m/sec and (3) the radionuclide concentration can be reduced to about 0.3 % at points about 15 m away from it. Thus, the stream about 150 m away from the TRIGA reactor is hardly influenced by the residual radionuclides.
INTRODUCTION
The simulation of the underground, long-term radionuclides migration around the TRIGA reactor site was studied to release the site to the unlimited reuse after TRIGA reactor decommissioning. Thus, the degree of radioactive impact on the area around the TRIGA reactor site by the residual radionuclides should be analyzed. For this study, first of all, streams, valleys, ridges, and water table in the study area were investigated to establish boundary conditions. Second, the soil in the study area is sampled and its hydraulic parameters are measured. Third, it is assumed that the major residual radionuclides of the TRIGA reactor site are 137Cs, 90Sr, 60Co of an average concentration 1.0 after TRIGA reactor decommissioning. The degree of radioactive impact on the area around the TRIGA reactor after 5, 10, 20, and 30 years is analyzed using a 3 dimensional numerical model.
TOPOGRAPHY AND WATER TABLE
The TRIGA rector was located in the north-east section of Seoul in Korea. Boundary conditions have to be established to simulate the TRIGA area. The north boundary side is on the stream in the Barrae valley, and the south boundary side is on the Sinnae stream. Also, the east boundary side is on a mountain ridge of 80-100 m above sea level and the west boundary side is on the east longitude 1270 04'31" line. The area surrounded by the boundary sides is named the study area. The south-north length of the study area is about 3.0 Km, and the east-west length is about 1.6 Km, and the study area is 3.8 Km2.
The study area was divided into 4 layers for model simulation. The upper side of the 1st layer is water table, the thickness of 1st layer is 3 m. The thickness of the 2nd and the 3rd layers is 7 and 20 m, respectively. Also, the bottom side of 4th layer is 38 m below sea level, and the thickness of the 4th layer varies in 30 - 100 m. The configuration of the water table and 4 layers is shown in Fig. 1. The method computing the water table is as follows. First, the water table of the streams in the study area was set into the elevations of the stream surfaces from sea level, and those at the other points were computed on the basis of the elevations of points and the distance between the stream and points.

Figure 1. Configuration of Water Table and 4 Layers
FIELD MEASUREMENT OF HYDRAULIC PARAMETERS
The surface part of the study area is covered by a clay layer of about 7 cm thickness, while the lower layer consists of silty sandstone as follows;
Clay Layer |
Silty Sandstone Layer |
Hydraulic Conductivity
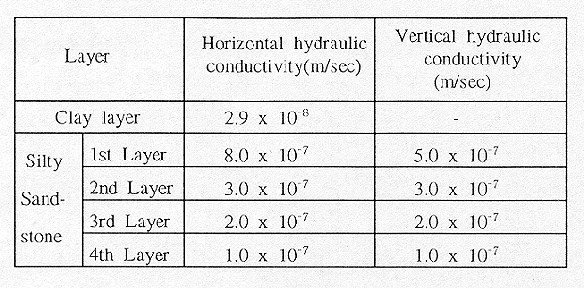
The silty sandstone of large hydraulic conductivity was measured by a constant head method, but the clay of small hydraulic conductivity was measured by a falling-head method. The hydraulic conductivity of each layer in the study area is listed in Table I.
Table I. Hydraulic Conductivity of Each Layer
Porosity and Moisture Content
The porosity(N) was calculated using the following equation.
N = 1 - r b/r s |
(1) |
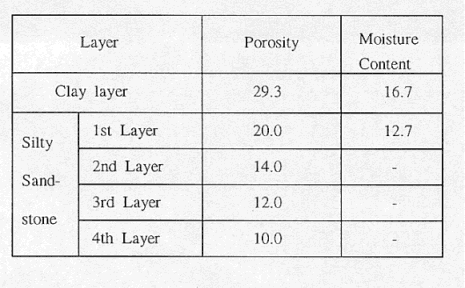
where, r b represents the bulk density and r s represents the solid partial density. Moisture content (q ) was calculated using the following equation and Vw is the weight subtracting dryweight of sample from total weight(VT). Porosity and moisture content of each layer are shown in Table II.
| q = Vw/ VT | (2) |
Table II. Porosity and Moisture Content of Each Layer
Dispersivity
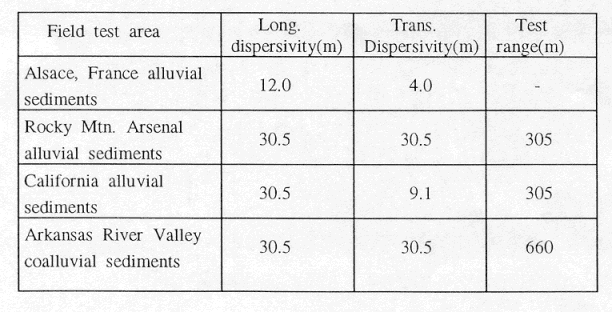
Sediment and silty sandstone have similar dispersivity. The dispersivity of sediments measured directly using a tracer is shown in Table III [1]. The longitudinal dispersivity of silty sandstone is assessed to 30 m and that of transverse dispersivity is assessed to 10 m.
Table III. Dispersivity of Sediments
Diffusion Coefficient
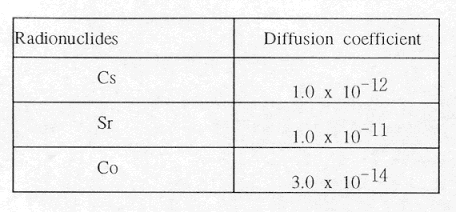
The diffusion coefficient of radionuclides in concrete is listed in Table IV[2].
Table IV. Diffusion Coefficient of Concrete
Distribution Coefficient
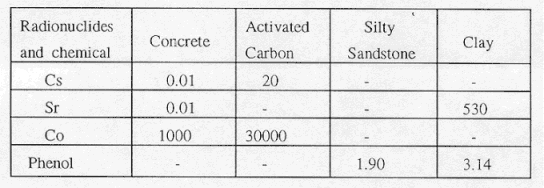
The procedure measuring the distribution coefficient of phenol is as follows. First, phenol samples of 5, 10, 20, and 40 ppm were prepared. The dry soil of 2 g picked up near the TRIGA reactor was put into each phenol sample of 200 ml. The initial concentration of the phenol sample was measured by the ultraviolet method, and then equilibrium concentration( mg/l ) of phenol was measured by the isothermal absorption test. Plotting the mass of absorbed phenol( mg/kg ) against the equilibrium concentration, the slope of the plotting line will be the distribution coefficient( Kd ). Distribution coefficients of radionuclides are listed in Table V[2].
Table V. Distribution Coefficient of Radionuclides and Phenol(ml/g)
Decay Constant
The kinds of radionuclides leaked from the TRIGA reactor and their half lives are listed in Table VI.
Table VI. Half Life(yr) of Radionuclides

GROUNDWATER FLOW MODELING
Numerical Model Introduction
In order to analyze the groundwater flow system around the TRIGA reactor, MODFLOW (A MoDular three-dimensional finite-difference groundwater flow model) developed by U. S. Geological Servey[3] was used. This model uses a finite differences method and its governing equation is as follows.
|
(3) |
where, Kx, Ky and Kz represent the hydraulic conductivity(LT-1), h is the hydraulic head(L), Ss is the specific storage(L-1) and t is time(T).
Preparation of Base Map
In order to examine the modeling results of groundwater flow and radionuclides transport more precisely, a base map of the study area was drawn up using autocad as shown in Fig. 2. This base map shows the location of boundaries of the study area, the TRIGA reactor, the Seoul Industrial University, Atomic Energy Hospital, apartment etc..
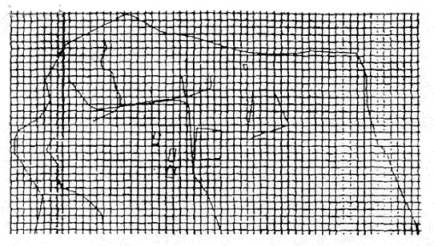
Figure 2. Finite Element Net About Study Area
Preparation of Finite Differences Net
The size of the study area is 3 x 1.6 km and the number of finite differences cells in XY direction is 60 x 32 = 1,920. The size of each cell is 50 x 50 m. Also, the study area consists of 4 layers. As shown in Fig. 2, the total number of finite difference cells of the study area is 7,680.
Boundary and Initial Conditions
The stream on north boundary and the Sinnae stream on south boundary were treated as a constant head. And, the ridge on east boundary was treated as a impermeable boundary due to a divide. The east longitude 127004'31" line in the west boundary was treated as a constant head. The upper boundary is the water table and the bottom boundary was treated as an impermeable boundary due to a relatively small hydraulic conductivity. The initial value of each node in boundaries was assumed to be 50 m.
Input Parameter
The input parameters required for the analysis of groundwater flow are hydraulic conductivity and porosity. Those were inputted according to the above- mentioned measuring values and assuming values.
Groundwater Flow Modeling
The groundwater flow was assumed to be steady-state and was analyzed on each layer with MODFLOW.
Results and Assessment
The result of modeling analysis on groundwater flow is shown in Fig. 3. A stream is located in about 200 m distance from the TRIGA reactor in north direction. The stream flows in west direction from the back mountain and flows in south direction in front of the TRIGA reactor, then flows to west direction again. The groundwater under the TRIGA reactor is mixed with the groundwater flowed in from the back mountain, and flows into the front stream. The groundwater under the Seoul Industrial University flows into the stream in south direction. The groundwater under the Atomic Energy Hospital flows into the stream in north-west direction. A pathway of groundwater inflicting the most critical impact by radionuclide contamination is assessed to be about the 150 m section from the TRIGA reactor to the front stream in west direction. And, the hydraulic head distribution system in the 2nd, 3rd and 4th layers is similar to that in the 1st layer. But the hydraulic heads in the east section of each layer in the study area decrease as the layer increase into the 2nd, 3rd, and 4th layer. On the other hand, those of west section increase as the layer increase into the 2nd, 3rd and 4th layer. Also an average flow velocity of groundwater under the TRIGA reactor is analyzed to be 0.6 - 1.8 m/year.
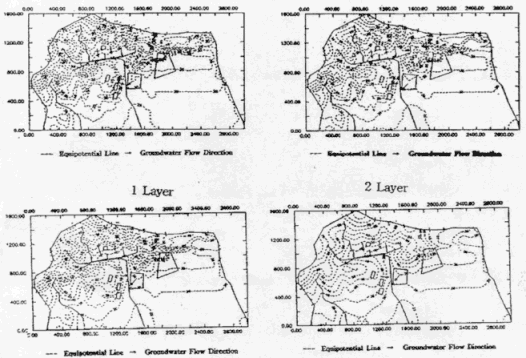
Figure 3. Groundwater Flow Modeling in 1, 2, 3 and 4 Layer of Study Area
RADIONUCLIDES TRANSPORT MODELING
Numerical Model Introduction
In order to analyze the radionuclides transport system around the TRIGA reactor, MT3D (a Modular Mass Transport 3-Dimension) was used[4]. MT3D uses a finite differences method and can exchange data with MODFLOW, and its governing equation is as follows.
|
(4) |
where, r b represents the bulk density(M/L3), C is the contaminant concentration (M/L3), S is the absorption concentration(M/M), t is time(T), v is the flow velocity (L/T), D is the dispersion coefficient(L2/T), l is the material decay constant(T-1), D* is the molecular diffusion coefficient(L2/T) and a is the longitudinal or transverse dispersivity(L)
Initial Conditions
In case the TRIGA reactor was contaminated by 137Cs, 90Sr, 60Co of an average concentration 1.0 due to an unexpected accident, the nuclide concentrations distributed in each layer around the TRIGA reactor after 5, 10, 20 and 30 years were calculated with MT3D.
Input Parameters
The input parameters required for the analysis of radionuclides transport are dispersion coefficient, material decay constant and distribution coefficient. These were inputted for each layer according to the above-mentioned measuring values and assuming values.
Radionuclide Transport Modeling
The groundwater flow velocity calculated with MODFLOW was used as an input data for the simulation of the radionuclide transport, and the radionuclide transport simulation was executed on each layer. The radionuclide concentrations distributed in each layer after 5, 10, 20 and 30 years were calculated with MT3D.
Analysis Results and Assessment
The 137Cs concentrations distributed around the TRIGA reactor of the 1st layer after 5 years since 137Cs, of an average concentration 1.0 was contaminated inside the TRIGA reactor area, are shown in Fig. 4(a). And Fig.4(b) is to enlarge only the circumference of the TRIGA reactor.
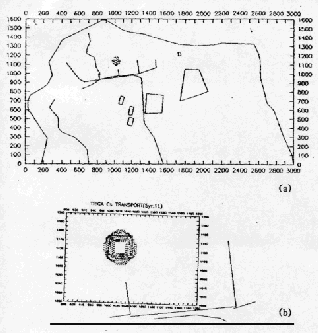
Figure 4. 137Cs Transport Modeling in 1 Layer of Study Area After 5 Years
The TRIGA reactor area was supposed to be contaminated by 137Cs, 90Sr, 60Co of an average concentration 1.0. The radionuclide concentrations distributed in each layer after 5, 10, 20, 30 years since then, were calculated with MT3D, whose results are shown in Fig.5.
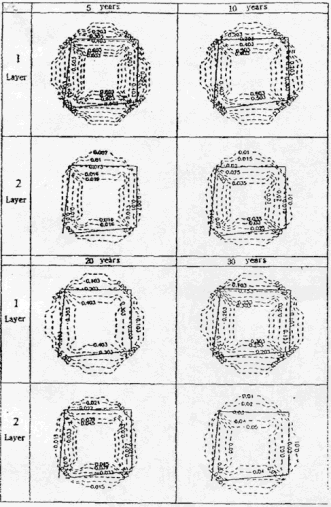
Figure 5. 137Cs Transport Modeling Around Reactor Along Time
Fig. 5 is the concentration distribution diagram of 137Cs in each layer along time. First, the 1st layer shows that an average concentration at the boundary lines after 5 years is about 0.39, and that after 10 years is about 0.31, and that after 20 years is 0.23 and that after 30 years is 0.14, Also, the concentrations at points about 15 m distance from the boundary lines of the TRIGA reactor are about 0.003 for all time steps. In the 2nd layer of Cs, an average concentration at the boundary lines after 5 years is about 0.011, and that after 10 years is about 0.018, and that after 20 years is about 0.026, and that after 30 years is about 0.026. Also, the concentrations at points about 10 m distance from the boundary lines are about 0.01 for all time steps. Meanwhile, the concentrations at the TRIGA reactor circumference in the 3rd and 4th layers are below 0.001.
In the 1st layer of Sr, an average concentration at the boundary lines of the TRIGA reactor after 5 years is about 0.38, and that after 10 years is about 0.30 and that after 20 years is 0.21, and that after 30 years is about 0.13. Also, the concentrations at points about 15 m distance from the boundary lines of the TRIGA reactor are 0.003 for all time steps. In the 2nd layer of Sr, an average concentration at the boundary lines after 5 years is about 0.011, and that after 10 years is about 0.018, and that after 20 years is about 0.025, and that after 30 years is about 0.026, Also, the concentrations at points about 10 m distance from the boundary lines of that are about 0.01 for all time steps. Meanwhile, the concentrations in the 3rd and the 4th layers are below 0.001.
In the 1st layer of Co, an average concentration at the boundary lines of the TRIGA reactor after 5 years is about 0.19, and that after 10 years is about 0.09, and that after 20 years is about 0.02, and that after 30 years is about 0.003, Also, the concentrations at points about 15 m distance from the boundary lines of TRIGA reactor maintain about 0.003 until 20 years but are reduced to below 0.001 after 30 years, in the 2nd layer of Co, an average concentration at the boundary lines after 5 years is about 0.000045, and that after 10 years is about 0.00004, and that after 20 years is about 0.000015, and that after 30 years is about 0.000004, Also, the concentrations at points about 7 m distance from the boundary lines are below 0.00003. Meanwhile, the concentration in the 3rd and 4th layers are below 0.00001.
CONCLUSIONS
REFERENCES