
VERIFICATION OF SUBSURFACE BARRIER INTEGRITY USING
PERFLUOROCARBON GAS TRACERS*
T.M. Sullivan, B.Gibbs, G. Senum, M. Schwartz, T. Hopkins, and J. Heiser
Brookhaven National Laboratory
Upton, NY 11973
*This work was performed under the auspices of the U.S. Department of Energy.
ABSTRACT
Use of perfluorocarbon (PFT) gaseous tracers shows promise as an excellent means of demonstrating subsurface barrier integrity. The PFT technology has been applied at Brookhaven National Laboratory to evaluate the colloidal silica (CS) barrier installed during the summer of 1997. This program involved two separate experimental phases. In the first phase, PFTs were injected into the native soil for a period of one day in the region adjacent to the proposed location of the CS barrier. The information was used to confirm that diffusion is the rate controlling transport mechanism and measure in-situ diffusion coefficients for the tracers in the native soil. This information is useful in interpreting data from the second phase of this study. In addition, the monitoring data was used to estimate the leak (injection) location. In the second phase, PFTs were injected into the region contained by the CS barrier and data have been collected to evaluate the performance of the barrier. In the experiment three unique PFTs were injected with the aim of increasing the resolution of leak detection. Two regions which provided essentially no added resistance to flow as compared to the native soil were detected in the bulk of the CS barrier.
INTRODUCTION
Subsurface barriers are being considered as a potential remediation technique at several DOE facilities. The ability to verify long-term subsurface barrier integrity through monitoring will be required to gain public acceptance of these barriers as either a primary or secondary means for confinement of wastes Use of perfluorocarbon (PFT) gaseous tracers shows promise as an excellent means of demonstrating barrier integrity. In a typical experiment, PFTs are injected into the central region contained by the barrier and monitoring ports outside of the barrier are used to measure the release of PFTs through the barrier. For an intact barrier, release rates are low and concentrations at the monitoring port are several orders of magnitude lower than the injection concentration. For a breached barrier, release rates are much higher in the region of the breach as compared to intact regions. This permits detection of imperfections in subsurface barriers with high resolution of the leak location.
The perfluorocarbon gaseous tracer (PFT)technology has been applied at Brookhaven National Laboratory to evaluate the colloidal silica (CS) barrier installed during the summer of 1997. This program involved two separate experimental phases. In the first phase, PFTs were injected into the native soil for a period of one day in the region adjacent to the proposed location of the CS barrier. The information was used to confirm that diffusion is the rate controlling transport mechanism and measure in-situ diffusion coefficients for the tracers in the native soil. This information is useful in interpreting data from the second phase of this study. In addition, the monitoring data was used to estimate the leak location. In the second phase, PFTs were injected into the region contained by the CS barrier and data have been collected to evaluate the performance of the barrier. In the initial testing three unique PFTs were injected with the aim of increasing the resolution of leak detection.
NATIVE SOIL EXPERIMENT
The experimental design for this program called for one injection port located 17.5 feet below ground surface surrounded by seven monitoring wells as displayed in Figure 1. The wells designated N1, N2, and N3 each had four monitoring ports at depths of 5, 10, 17.5, and 25 feet below grade. The other four wells, E1, S1, S2, and W1 had three ports at 10, 17.5 and 25 feet. Twenty-four monitoring ports were used in the experiment. Wells E1, S1, W1 and N1 are five feet from the injection port in the X-Y plane. Well N2 is 15 feet and wells S2 and N3 are 25 feet from the injection port This range of distances was chosen to reflect the potential range between the injection point and the monitoring points in the CS barrier experiment. The PFT, ortho-cis-perfluorodimethylcyclohexane, ocPDCH, was injected into the subsurface at the center of the monitoring wells for a period of one day a nominal flow rate of 15 cm3/min at an ocPDCH concentration of 30 ppm. A sampling plan was developed for each well based on the distance from the injection point. Samples were taken over a 21 day period beginning May 27 and ending on June 17. In all, over 250 samples were collected and analyzed.

Figure 1. Monitoring port locations for the soil diffusion coefficient test.
The data were interpreted using an infinite medium diffusion model for a one day injection of PFT. The infinite medium assumption neglects the effects of the ground surface. Based on the data, this assumption was good for all monitoring ports located more than 10 feet below grade. The projections of this model are spherically symmetric with the concentration dependent on the total distance from the source. The results of the analysis support the following conclusions:
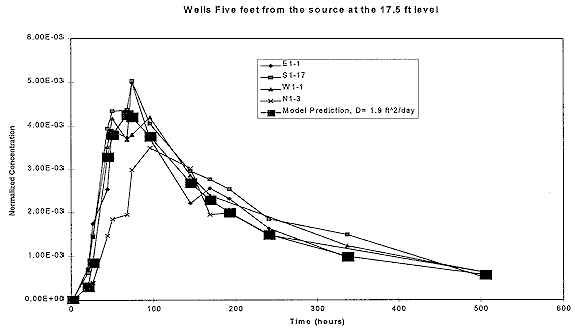
Figure 2. Best fit gaseous diffusion coefficient for monitoring ports located five feet
from the source at the 17.5 ft depth.
COLLOIDAL SILICA BARRIER EXPERIMENT
Upon completion of the Colloidal Silica (CS) barrier installation, testing of the barrier integrity using both PFT and sulfur hexafluoride (SF6) gas tracers was initiated. Both systems used the same monitoring ports. Test results using sulfur hexafluoride are presented elsewhere. Figure 3a and 3b provide a schematic representation of the barrier and monitoring wells. The internal barrier dimensions of the barrier form approximately a twenty foot square. The barrier walls are nominally 4.25 feet thick. The east wall of the barrier was injected at a 45 degree angle to the ground surface. Therefore, in plane view of the top (Figure 3a), this wall is approximately 6 foot thick. However, the minimum thickness of the barrier remains 4.25 feet. The sloping wall gives the North and South walls a triangular shape, Figure 3.b. There are eighteen exterior monitoring wells located two to three feet outside of the barrier. The monitoring wells have between one and five monitoring ports and are spaced approximately seven feet apart.. The ports in each well are spaced approximately seven feet apart and the total number of exterior monitoring ports is fifty-four. In addition, there are five injection/monitoring wells located inside the region bounded by the CS barrier. The interior wells have between one and three monitoring ports spaced five feet apart. To minimize leakage of gas tracers over the top of the barrier, the top three feet of soil over the barrier was excavated and a polyethylene liner was placed on top of the barrier. The liner was covered with the excavated soil to complete the seal.
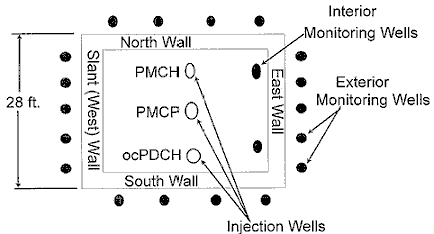
Figure 3a. Top Plan View of the Colloidal Silica Barrier with approximate locations of
PFT injection wells and all monitoring wells.
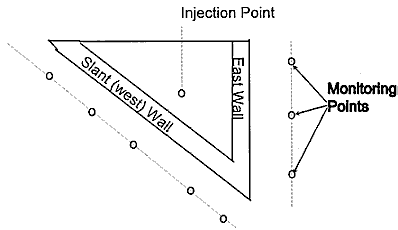
Figure 3b. Side view of the Colloidal Silica Barrier with a schematic representation of
the monitoring points along the exterior of the barrier.
Injection and Sampling Plan
The injections began on September 10 at 4:30 PM EST with three different PFT tracers, perfluorodimethylcylobutane (PMCH), orthocis perfluorodimethycylochexane (ocPDCH,) and perfluoromethylcyclopentane (PMCP) with injection concentrations of 400 ppm, 20 ppm, and 0.1 ppm, respectively. Injection locations are displayed in Figure 3. PMCH tracer was injected in the middle region of the barrier three feet from the North wall, PMCP was injected into the middle of the barrier region, and ocPDCH was injected in the middle region of the barrier near the south wall. All tracers were injected at a nominal flow rate of 15 cm3/min for a period of four and one-half days ending on September 15 at 9:00 AM EST. At this flow rate, approximately 95 liters of air with the tracer was injected. Only a minor displacement of air in the region contained by the barrier was caused by the injections. .
The analysis procedure initially sampled all monitoring ports on a two day cycle. The procedure was followed for the first ten days of the test subject to modification from test results. The results from the native soil experiments indicated that tracer should not reach the exterior monitoring points in appreciable quantities during the first ten days. After ten days, two apparent breaches in the barrier were detected. To obtain a consistent picture of the tracer concentration distribution after this time, sampling was conducted to take all monitoring ports along a wall of the barrier on the same day. Sampling was continued through October 23, five weeks after the start of the experiment. All fifty-four sampling locations were monitored twice a week for tow weeks and once a week thereafter. In total over 450 samples were analyzed to provide a detailed picture of the time evolution of PFT concentration outside of the viscous liquid barrier.
Sampling of interior ports was performed to define diffusion coefficients through the barrier and to determine the distribution of contaminants inside the barrier after injection. This may be particularly important if the SF6 injections occur after the PFT injections causing advective transport on top of diffusive transport.
Sampling Results
Data collection has been completed and a complete analysis of the size and location of the leaks based on the PFT data is being conducted. Preliminary analysis of the data indicates two areas in the bulk of the wall which are clearly leaking. In addition, leakage between the top of the barrier and the polyethylene cover is occurring in several areas. The source of tracer appearing at the monitoring wells on the North and South walls appears to be from leakage over the top. This is evidenced in Figures 4 and 5 which depict tracer concentration contours detected using PFTs. The filled in circles on these diagrams mark the sampling locations. These contours were developed form data taken September 25. Data at later dates showed similar profiles. Both walls are leaking at a higher rate nearer the region where they key into the slant wall at a shallow depth near the western edge of these walls. The leakage is non-uniform across the length of both of these walls indicating that the seal is better in some regions of the barrier.
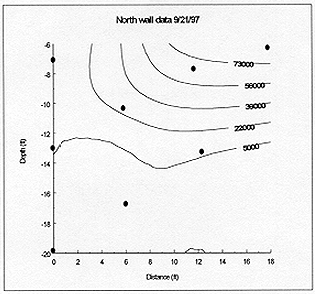
Figure 4. North Wall PMCH Contours
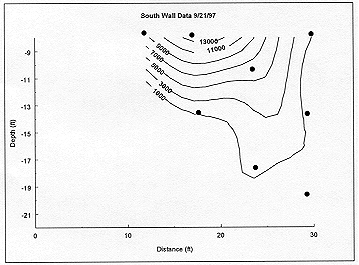
Figure 5. South Wall ocPDCH Contours
The East Vertical walls shows leakage centered around a depth of fifteen feet below grade approximately twelve feet into the panel. In addition, leakage over the top was demonstrated at the far right (panel distance greater than 30 feet), figure 6. The first leak was detected by the tracer ocPDCH and the surface leak was detected through the PMCH tracer. This reflects the relative distance between the injection point and these sampling locations for each tracer. Samples taken at later times provided similar results. All of the data showed elevated concentration levels in the same region of the barrier and leakage over the top.
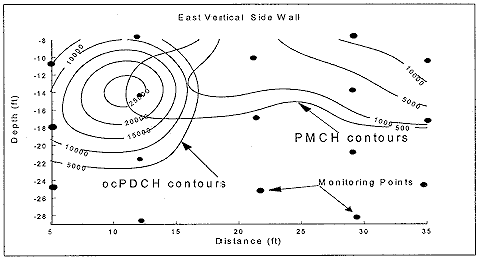
Figure 6. East Wall (vertical side wall) tracer contours (note different scales
on contours).
The West (slant) Wall also shows evidence of leakage, Figure 7. The leak in the bulk of the wall is nearly twelve feet into the panel at a depth of seventeen feet below grade (twenty-four feet distance along the monitoring well installed at a 45° angle). This leak was first detected with the tracer PMCH. Leakage is also occurring over the top of the panel as shown from the ocPDCH contours in Figure 7. Contours obtained at later times showed approximately the same distribution of tracer.
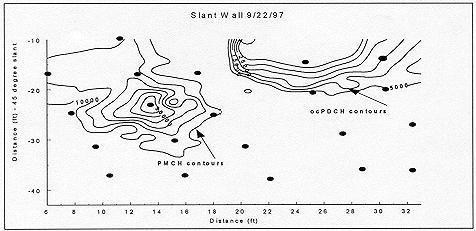
Figure 7. West (slant) wall tracer contours (note different scale on contours)
CONCLUSIONS
PFT technology has been used to evaluate the integrity of the colloidal silica barrier installed at BNL. The program involved two experimental stages. In the first stage, the PFT ocPDCH was injected in the native soil. Soil diffusion coefficients were estimated from the data and the accuracy with which the source could be located was evaluated. In the second stage, three PFTs were injected into the central region contained by the colloidal silica barrier. The time evolution of concentration at fifty-four external monitoring points was measured over a period of five weeks and the data were interpreted. The data indicate two regions in the barrier which are not performing as designed.