GEOPHYSICAL ASSESSMENT OF A THIN WALLED
CEMENT-BENTONITE SUBSURFACE BARRIER -
PRELIMINARY RESULTS
David Reichhardt
MSE Technology Applications, Inc.
200 Technology Way
Butte, MT 59701
(406) 595-7195
e-mail: dreichha@in-tch.com
William Daily
Lawrence Livermore National Laboratory
Livermore, CA 94550
Phone Number: (510) 422 - 8623
e-mail: daily@llnl.gov
ABSTRACT
This paper presents the results, to date, of a geophysical assessment of a jet-grouted, thin walled, cement-bentonite subsurface barrier, which was funded by the DOE-EM Office of Science and Technology. The investigations were designed to determine the areal extent of the barrier for producing an as-built image of the structure. This information is necessary to confirm that the barrier meets the design specifications. It can also be used to aid in the planning and deployment of other verification and monitoring activities such as hydrologic and gaseous tracer methods.
Subsurface barriers are being considered as viable interim and potential remediation options for many U.S. Department of Energy waste complex sites. A key component of the use of subsurface barriers for waste containment is the ability to verify that the barrier is adequately installed and integrity is maintained sufficiently to meet the isolation requirement.
The geophysical methods tested that will be presented in this paper include: 1) borehole seismic, 2) borehole radar, 3) borehole electrical resistivity, and 4) borehole electromagnetic conductivity logging. With the exception of the borehole electromagnetic conductivity logging, all of the methods were deployed in a cross borehole configuration. Data were acquired prior to installation of the barrier and after the installation, to allow for pre- and post-grout data comparisons, and/or the differencing of the data.
The preliminary results indicate that for the grout materials used, electrical resistivity methods held the most promise for imaging the barrier extent (the resisistivity data was not ready for publication in this paper). Borehole radar and seismic methods also appear to hold promise for imaging the barrier extent; however, additional data will be required to complete the radar and seismic work. The electromagnetic conductivity logging proved to be a useful for strategraphic characterization and to assess the electrical conductivity of the soil, which affects the response of the borehole radar and the electrical resistivity systems.
INTRODUCTION
The use of subsurface barriers constructed in situ at waste sites is being considered as a viable interim and potential remediation option for many U.S. Department of Energy (DOE) waste complex sites. A key component in the application of subsurface barriers for waste containment is the ability to verify that the barrier is adequately installed and the integrity is maintained sufficient for the isolation required. The verification that a barrier has been emplaced as planned requires demonstrating that the barrier does not contain flaws or holes and that it has the required physical dimensions.
A subsurface barrier emplacement demonstration funded through the DOE-EM Office of Science and Technology provided an opportunity to test and develop various methods for verifying the integrity of a subsurface barrier. The methods tested and demonstrated for detecting holes in the barrier are hydraulic testing, often employing both liquid and gaseous tracers, and geophysical techniques, which were tested and demonstrated for defining the physical extent of the barrier system. The geophysical efforts are presented here.
The geophysical methods tested include cross borehole ground penetrating radar (GPR), cross borehole seismic, cross borehole electrical resistivity tomography (ERT), and single borehole electromagnetic (EM) conductivity logging.
The project was divided into two phases of work. The first phase (Phase I) consisted of constructing four small barriers for refining the emplacement methods and the verification and monitoring methods. The second phase (Phase II) of the project was the construction of a larger barrier and the application of the verification and monitoring technologies to the barrier. The objective of the geophysical efforts for Phase II was to construct an as-built image of the barrier.
PRELIMINARY PHASE I GEOPHYSICAL EFFORTS
The Phase I efforts showed that the cross borehole ground penetrating radar used in a transmission mode and cross borehole electrical resistivity tomography held the most promise for imaging the emplaced barrier material. In addition to imaging the barrier extent, the electrical resistivity method (ERT) was used to monitor a salt water injection, which showed the presence of a leak in one barrier.
Seismic methods did not work well in a transmission mode for detecting and imaging the barrier material; however, it was believed that seismic methods used in a reflection mode from boreholes outside the barrier might be successful. Because of the placement of the Phase I boreholes, assessing this in the field during Phase I was not possible. A design modification to the borehole placement was therefore required for Phase II to allow for seismic reflection data to be taken.
The EM conductivity logging proved most useful for characterization of the electrical properties of the formation surrounding the boreholes, which affected the GPR and electrical resistivity measurements. For Phase I this was important because the boreholes were only 1 to 2 meters from the barrier.
Additionally, the Phase I work confirmed that differencing data acquired before barrier emplacement with data acquired after barrier emplacement significantly increased the resolution of the geophysical techniques. This requires the boreholes used for the geophysical measurements be installed and geophysical data taken prior to barrier construction.
PHASE II BARRIER GEOPHYSICAL EFFORTS
The conceptual Phase II barrier is shown in Figure 1. Based on Phase I results/lessons learned, the locations of 21 boreholes used for geophysical data acquisitions were determined. They are also shown in Figure 1. The barrier was originally planned as a double walled barrier, although budget and construction constraints dictated that a single walled barrier approximately 10 meters in diameter be constructed. This change in construction was made after the baseline geophysical data had been taken; therefore, the data aquisition plan originally intended for a double walled barrier was not easity changed. The barrier was emplaced to a depth of approximately 13 meters below ground surface (bgs), which included a 2 meter key into a clay aquitard at approximately 11.3 meters bgs at the site. The grout emplacement was terminated approximately 1 meter bgs. The single wall barrier thickness was estimated based on Phase I data to be approximately 0.30 meters.
Figure 1. Conceptual Phase II Barrier and Well Locations.
The geophysical boreholes where constructed of 4 inch flush coupled schedule 40 PVC well casing installed to a depth of 16.75 meters bgs and completed with #2 well gravel. The wells were screened with 0.020 inch slot screen from 16.75 meters bgs to 6 meters bgs to accommodate groundwater measurements. Nine of the boreholes had electrodes attached to the outside to facilitate the ERT measurements (these boreholes are shown on Figure 1).
Twenty boreholes were installed in a radial pattern centered on the barrier with one borehole installed at the planned center of the barrier. The radial distance from the center borehole to the outer boreholes is approximately 10 meters. The distance between boreholes on the outer ring is approximately 3.35 meters. The exact locations and elevations of the boreholes were surveyed after installation and re-surveyed prior to each round of data acquisition to ensure monitoring well locations did not change during the grouting process.
Electromagnetic Borehole Logging
Each geophysical borehole was logged using a Geonics EM-39 borehole logging system prior to and after grout injection. The EM data were used to assist in characterizing the local stratigraphy at the Phase II site. The site stratigraphy based on the EM data and from observations during drilling is presented in Figure 2.
Figure 2. Phase II Site Stratigraphy.
Borehole Ground Penetrating Radar
The borehole GPR data were taken using a Sensors and Software pulseEKKO 100 borehole radar system with 100 MHZ antennas. The data were taken at 0.25 meter intervals along the entire length of each borehole. Reflection data were taken from borehole pairs around the outer ring. To accomplish this, the transmitting antenna was placed in one borehole and the receiving antenna was placed in an adjacent borehole. The antennas were then moved down the entire length of the two boreholes, taking a measurement every 0.25 meters. This is commonly called a zero off-set profile mode. Transmission data were taken using the central borehole and each of the outer boreholes in a manner similar to the reflection data, also in a zero off-set mode. The GPR data were taken before and after barrier emplacement to allow for differencing of the data.
The results of the GPR measurements are shown in Figure 3. Figure 3a is a plot of the pre- and post-grout GPR velocities determined from the transmission data measured between the central well (GP2-21) and well GP2-12. Figure 3b is the pre-grout GPR borehole reflection section from boreholes GP2-12 and GP2-13. Figure 3c is the post-grout GPR borehole reflection section from the same boreholes.
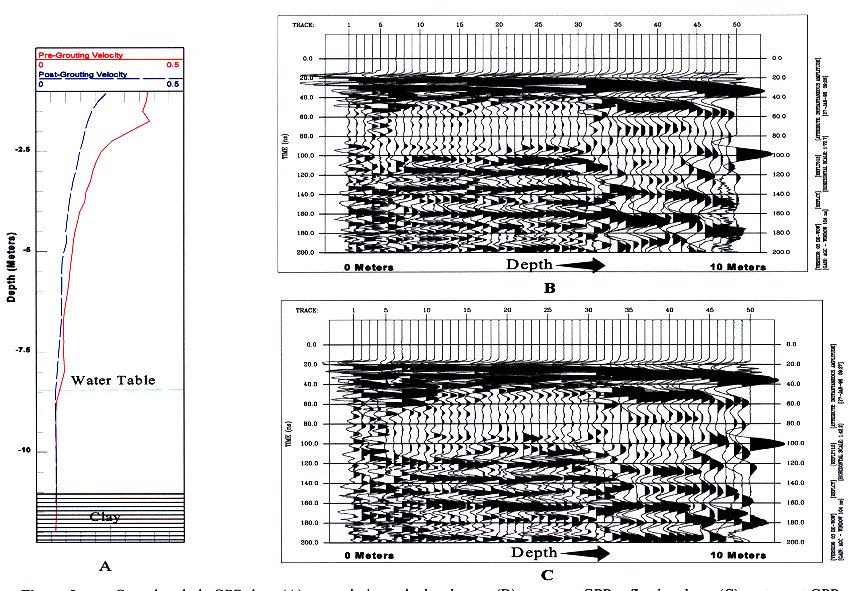
Figure 3. Cross Borehole GPR Data, (a) Transmission Velocity Change, (b) Pre-Grout GPR Reflection Data, (c) Post Grout GPR Reflection Data.
The velocity data presented in Figure 3a show a decrease in the GPR velocity for the soils after the grout has been emplaced. The data do not provide information on the barrier wall thickness or location, only that a change has occurred due to the grout and the grouting process that slowed the GPR wave. Observations from Phase I GPR transmission data indicated that the slowing down of the GPR signal in the subsurface had good correlation with the presence of the barrier materials above the water table. The velocity difference goes to zero near the water table (»8 meters below ground surface) where the pore water dominates the attenuation of the signal and the small change in the formation properties from the grout are insignificant.
The observed change in the GPR velocity between the pre- and the post-grout data suggests that cross well tomography might be used to produce an image of the barrier extent above the water table. This was not done because of the time requirements both in the field and in processing to produce the tomographic image. Additionally methods of imaging the barrier from wells placed outside, or what would be the uncontaminated side of the barrier at a waste containment site, were being investigated, and this is generally not the case with tomographic methods.
The pre- and post-grout GPR reflection data (Figures 3b and c) indicate that the barrier did not provide a sufficient reflector for the GPR signal. A careful comparison of the two data sets does not reveal any significant difference between them such as a reflection from the barrier at the expected times based on calculations from the direct arrivals. The data were taken in the zero offset mode as described above. Additional data were taken in multiple offset modes with the antennas in both the same borehole, in adjacent boreholes, and in alternating boreholes (i.e., GP2-01 and GP2-03). None of these configurations produced data that contained a reflection off the barrier. This was determined by comparing the pre- to the post-grout data.
Borehole Seismics
After reviewing the seismic results from Phase I, it was thought that for seismic methods to be applied to the problem of locating the barrier in the subsurface, a reflection mode might work better than a tomographic mode. This is because the significant amount of air injected with the grout, the seismic energy is severally attenuated and is not transmitted through the barrier. Therefore, the boreholes were installed to accommodate reflection seismic data acquisition for Phase II. The seismic data were acquired using an EG&G 2401x seismograph and 12 Geophysical Survey Systems DH-5 Down Hole Hydrophones spaced 0.3 meters apart. The seismic source used was a Bolt Air Gun firing at 18.5 Kg/m2.
Seismic data were taken by placing the hydrophones in one of the outer boreholes with the air gun in an adjacent borehole such that it was located at the same elevation as the center of the hydrophone array producing 12 channel common mid point (cmp) shot gathers. For record keeping purposes, the depth of the air gun was used as the depth recorded for the shot gather. Data were taken in this configuration from 13.7 meters bgs to 10.7 meters bgs (11 shot gathers per hole) for all external adjacent borehole pairs. The data from each shot gather were then stacked to produce eleven seismic traces for each borehole. An example of pre-grout stacked data for a borehole pair is shown in Figure 4a, and the same section after grouting is shown in Figure 4b.
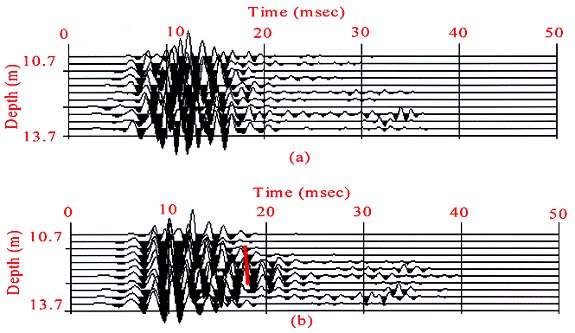
Figure 4. Cross Bore Seismic Reflection Data, (a) Pre-Grout Reflection Data, (b) Post-Grout Reflection Data.
A reflection that may correlate with the barrier is shown on Figure 4b indicated by the red line. This reflection is difficult to distinguish and is not obvious in all of the seismic data. It is thought that an increased offset (i.e., going from 12 channels per gather to 24 channels per gather) may help to better distinguish this reflection.
Electrical Resistivity Tomography
ERT data were taken by Lawrence Livermore National Laboratory (LLNL) prior to and after grout injection using the vertical electrode arrays installed on the geophysical boreholes. The data were taken to allow a 3D inversion of the electrical resistivity distribution of the subsurface. Preliminary indications are that with the acquisition of the pre- and post-grout data, a sufficient electrical resistivity contrast does exist to produce an image of the barrier, however, at this time, the data have not been fully processed.
RESULTS
The results of the geophysical efforts to image the cement-bentonite barrier emplaced at Dover AFB during FY97 suggest that additional effort will be required to evaluate the techniques.
The GPR method, as applied, did not record reflections of the GPR signal from the barrier, however, the data obtained did suggest that tomographic imaging may be capable of producing an image of the barrier extent above the water table. This is based on the observation that the barrier had a measurable affect on the velocity of the radar wave. The possibility of using tomography to image the barrier could be verified in the field at the site or through a modeling exercise. The reflection and transmission data acquisition required approximately half a day for two people to complete. A multiple offset data set was also taken which required approximately 40 minutes for a well pair. To take multiple offset data for tomographic imaging for the entire 20 well pairs would require two people approximately a day and a half. Tomographic processing would require approximately 2 to 4 weeks for all twenty tomographic sections.
A modification to the seismic data acquisition, which would include additional offsets to distinguish the reflections from multiples and direct arrivals should also be investigated. Acquisition of seismic data with an increase in the number of channels per shot gather would require approximately 2 days for two people in the field. Processing would require an additional 2 weeks.
The ERT method appears to hold the most promise based on the preliminary result for imaging this type of barrier. This method can be used with minimal site preparation costs. The electrodes can be installed using a cone penetrometer or attached to monitoring wells. Of the three geophysical methods applied to the problem of barrier imaging, ERT data required the least amount of time in the field, but it was not significantly less than either the seismic or the GPR. Data processing requires a higher degree of specialization than the GPR and seismic methods, however, once the data processing scheme for a given barrier or site has been established, it could be applied repeatedly over time serving as a monitoring system.
Consideration must be given to issues of cost, waste management during site preparation, data acquisition and processing time, and repeatability of a system for long term monitoring applications. The need for pre- and post-grout emplacement data was made quite apparent during this project. A number of anomalies in the post-grout data that appeared to be the barrier were effectively eliminated through careful comparisons with the pre-grout data. This information is important for ensuring that a proper geophysical assessment of the barrier has been completed.
The construction of the as-built image was not completed for this project given the data available. However, it is believed that an image could still be developed with additional field work.
ACKNOWLEDGMENTS
Work was conducted through the DOE-EM Office of Science and Technology at the Western Environmental Technology Office under DOE Contract Number DE-AC22-96EW96405.