USING ASPEN SIMULATION PACKAGE TO DETERMINE
SOLUBILITY OF MIXED SALTS IN TRU WASTE
EVAPORATOR BOTTOMS
Jeff Hatchell
Los Alamos National Laboratory
Nuclear Materials Technology Division
Los Alamos, NM 87545
ABSTRACT
Nitric acid from plutonium process waste is a candidate for waste minimization by recycling. Process simulation software packages, such as Aspen, are valuable tools to estimate how effective recovery processes can be, however, constants in equations of state for many ionic components are not in their data libraries. One option is to combine single-salt solubility’s in the Aspen model for mixed salt system.
Single salt solubilities were regressed in Aspen within 0.82 weight percent of literature values. These were combined into a single Aspen model and used in the mixed salt studies. A simulated nitric acid waste containing mixed aluminum, calcium, iron, magnesium and sodium nitrate was tested to determine points of solubility between 25 and 100oC. Only four of the modeled experimental conditions, at 50oC and 75oC, produced a saturated solution. While experimental results indicate that sodium nitrate is the first salt to crystallize out, the Aspen computer model shows that the most insoluble salt, magnesium nitrate, the first salt to crystallize. Possible double salt formation is actually taking place under experimental conditions, which is not captured by the Aspen model.
INTRODUCTION
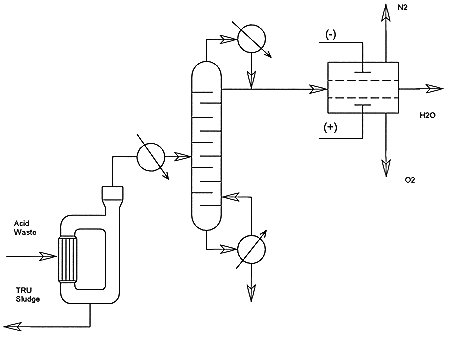
Plutonium is recovered from a variety of contaminated materials by aqueous processes. Recovery is usually performed in nitric acid with high molarity, but once processed, all the acid becomes a liquid radioactive waste. Traditionally, waste nitric acid solutions are neutralized and are then processed in a clarifier employing a carrier precipitation to remove trace plutonium. The precipitate is mixed with cement, generating a TRU waste. The filtrate is evaporated and produces another residue, which is also mixed with cement and generates a LLW. One possible waste minimization program is to recover the nitric acid, and recycle it back through the recovery processes before it is finally processed to TRU and LLW. One possible recovery operation, depicted in Figure 1, calls for the acid waste to first be run through an evaporator. The salts are separated from the recovered nitric acid and the volume of waste acid is reduced by driving off water and nitric acid into the evaporator distillate and the soluble cations are concentrated into a sludge. The evaporator distillate is then run through a distillation column producing a recyclable nitric acid off the evaporator bottoms. The overhead, having a very weak nitric acid concentration, could be processed by membrane separation to produce another recycle stream, or by electrolysis to convert the remaining nitrate to nitrogen, and oxygen.
Figure 1. Process Flow Diagram for the Recovery and Recycle of Nitric Acid
The point of saturation in the evaporator must be anticipated. If the evaporation is taken too far salts may crystallize while they are in process equipment rather than in systems designed for handling solids. This can result in shut down of equipment as well as difficult and expensive maintenance. If the evaporation is stopped too soon, recovery of nitrate decreases and the volume of TRU waste increases. Therefore, the conditions of saturation define the point of maximum cost savings achieved by waste minimization.
THEORETICAL
In electrolyte systems, salt solutes ionize into solution, which is represented by the general equation:
| (1) |
where M is a cation of charge z+ and X is an anion of charge z-. To understand the limit in which a salt is ionized, or the limit of its solubility a better approach is to look at its equilibrium constant. The equilibrium constant, or solubility product, of the salt is written as:
 |
(2) |
The thermodynamic equilibrium constant is written as :
| (3) |
Substituting the definition of activity we get the expressions:
| (4) |
| (5) |
| (6) |
or solving for solubility product:
 |
(7) |
Thus modeling the solubility product includes the thermodynamic equilibrium and the activity coefficient equilibrium for simultaneous phase and chemical equilibrium. Aspen can regress solubility data then calculates a value for the solubility product (Ksp) as a function of temperature, while actual solubility data of a mixed salt system incorporates both the thermodynamic and activity equilibrium constants.
EXPERIMENTAL
For solubility experiments a 500 milliliter-three-neck-round-bottom flask was used as the solubility vessel. The flask was placed in a heating mantle fitted with a magnetic stirrer. Circuitry in the mantle was modified to provide continuous stirring while allowing for intermittent heating. The solubility of magnesium nitrate in water was verified at several temperatures to establish the experimental and analytical, equipment, procedures and techniques. Concentrations of cations were measured using a Leeman Laboratories Sequential Inductively Coupled Plasma Spectrophotometer (ICP). The technique has the advantage of analytically measuring the concentrations of multiple cations simultaneously.
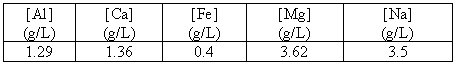
A bulk salt mixture was then prepared that had the components and relative amounts of nitrate salt, which matched a 2 M nitric acid waste stream with the cation composition shown in Table I.
Table I. Concentration of Cations in LANL Acid Waste
Experiments then determined points of saturation for the mixed salt at temperatures varying from 20 to 100 oC and acid concentrations varying from 0 to 12 M in nitric acid. Solid-phase salt samples were also removed from several of the saturated solutions and were analyzed to determine the cation least soluble in the bulk salt mixture.
Mass balances around the solubility vessel served as the input to an Aspen process simulation to determine how well the simulator predicted the overall experimentally determined solubility.
Aspen Simulation Approach
The experimental runs were compared to an Aspen simulation, which modeled solubilities. The concentrations of salts, nitric acid, and water in the experimental program served as the input to Aspen. Aspen was then used to predict performance of the evaporator under process conditions. With a good fit to the experimental data, we would feel more confident that Aspen could be used to accurately predict conditions that were not included in the experimental program.
When modeled as in Figure 2, Aspen calculates the solubility of salts . The "heater" unit operation insures that all streams are isothermal, and the "separator" unit operation can be specified such that all solids are separated from all liquids. When there is flow from the solids stream, then the liquid stream represents a liquid that is saturated in a salt.
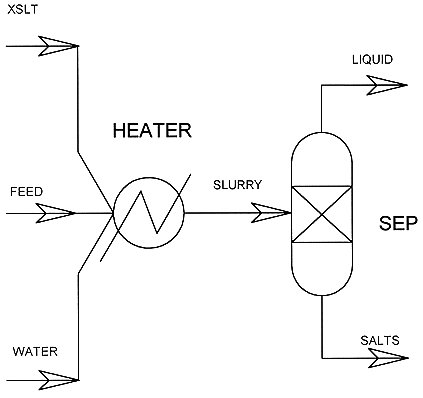
Figure 2. Aspen Flow Chart for Solubility of Mixed Nitrate Salts
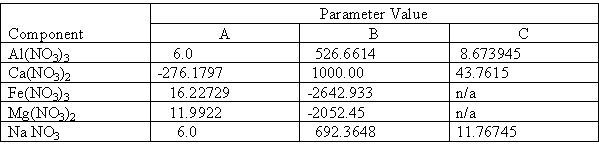
The Aspen simulation requires chemical, and thermodynamic properties of all substances used in simulations. Although Aspen’s inorganic data base contains the properties of magnesium nitrate, sodium nitrate, and calcium nitrate tetrahydrate, magnesium nitrate hexahydrate, and all the other salts are absent. To address this problem the published values of solubility in water as a function of temperature were regressed as an ideal system, producing an equilibrium fit for the solubility for each component. The fits were then verified. Both the regression and verification were performed using the Aspen expert system. Combining the regressions into a single model produced the final simulation package used in this study. The experimental conditions producing a saturated solution were duplicated as the feed stream for Aspen. The resulting liquid stream compositions were compared with experimental results. Any solids Aspen predicted were compared with those analyzed from the solubility vessel.
Aspen uses the New Britt-Luecke algorithm to fit data to an equilibrium constant of the form:
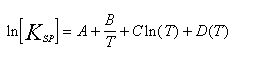 |
(8) |
Two and three parameter fits were obtained for the single salts, the results of which are shown in Table II.
Table II. Results of Regression of Solubility Data to Equilibrium Constant
Mixed Salt Runs
This part of the experimental program consisted of using the same technique used in the verification runs to determine the concentrations of mixed cations in a solution that was saturated in one or more of the salt species at varying temperatures and nitric acid concentrations. The solubilities of magnesium, sodium, calcium, aluminum, and iron nitrate salts’ in water are presented in Table III.
Table III. Solubilities of Single Nitrate Salts in Water
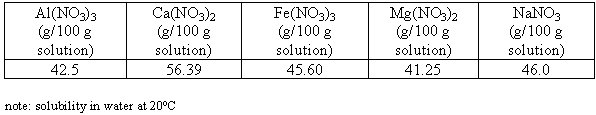
We see that magnesium nitrate is the most insoluble salt. We also see in Table I that magnesium has the highest concentration in the acid waste, so that we could expect that magnesium nitrate would be one of the first salts to reach the solubility limit and form solids.
Concentration of Cations at Saturation vs. Acidity and Temperature
The results of the mixed salt study are summarized in Table IV, which shows the concentrations of individual and total cations at saturated conditions at varying acidity and temperature.
Table IV. Concentration of Cations at Saturation vs. Acidity and Temperature
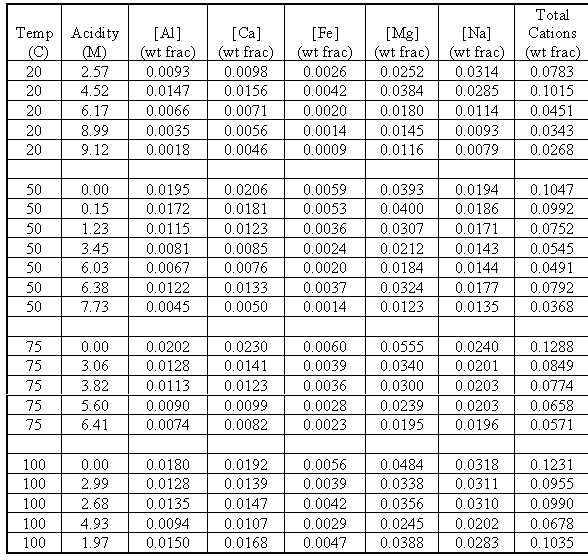
The values of total cation concentrations represent the overall solubility of the solution under a given set of conditions. These are the values of interest for operation of the evaporator. The data shows that the overall solubility of nitrate salts decrease as nitric acid concentration increases. We also see that as the temperature increases, so does the solubility. A plot of solubility vs. temperature at specific nitrate concentrations indicates whether common ion effect, nitrate anion, or temperature is the stronger variable for solubility.
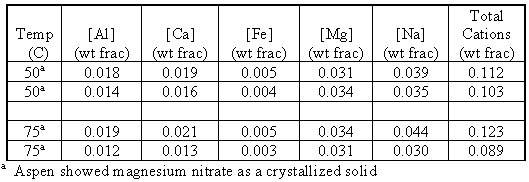
Input to each Aspen simulation matched each experimental condition; the amounts of salts, nitric acid, and water were the same. Only four of the Aspen simulations, the concentrations of individual and total cations are shown in Table V, resulted in saturated solutions with salt crystallizing. The other simulations resulted in all salts going into solution and a saturated solution was not achieved.
Table V. Concentration of Cations at Conditions from Aspen
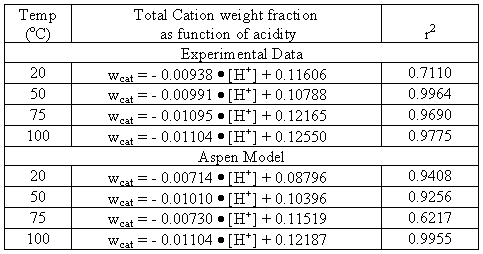
First order linear regressions were taken of the experimental data from Figure 4 and from the Aspen results in Table V. The equations and r2 values are listed in Table VI.
Table VI. Resulting First Order Regression of Total Solubility of Nitrate Salts
The regressions are now used to determine points of constant temperature at specific acidity. This then indicates how important the overall solubility is to temperature variations comparative to acidity. These results are shown in Figure 3. With these plots we see that the experimental data common ion effect is more important than temperature.
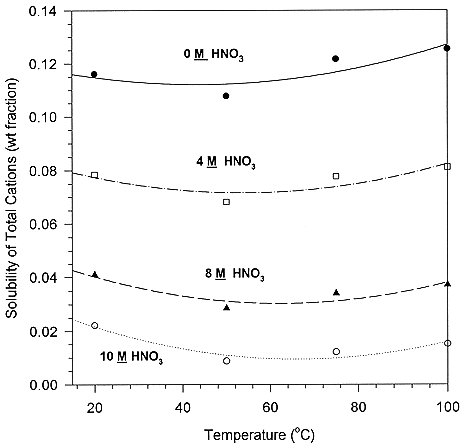
Figure 3. Solubility of Total Cations in Solution vs Temperature at Specific Acidity's
Application of the Aspen model to the order of crystallization
Experimental evidence indicates that aluminum nitrate is the major salt crystallized; however, the Aspen model indicates that order in which the cations crystallize is magnesium nitrate, followed by aluminum, sodium, ferric, and calcium nitrate salts. Though inconsistent with the evidence, the Aspen model still gives insight to crystallization behavior. Figure 4 shows that the point where salts crystallize is very dependent on the amount of water in the system. Since so much water of hydration is already associated with the salts, any additional water tends to take them into solution very easily. In the literature, melting points are given for some of the salts. But the melting point is not really a point where the thermal energy is overcoming the crystal structure of the substance, rather it really seems to represent the temperature at which the water of hydration is enough to solubilize the salt into solution and so represents a point of self dissolution.
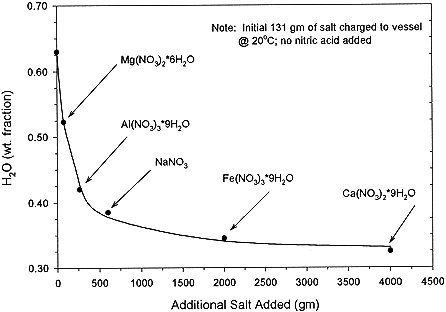
Figure 4. Points of Crystallization of Nitrate Salts by Aspen
CONCLUSIONS
Using a data regression mode, Aspen successfully modeled all the solubilities of single salts. The Aspen model predicted that magnesium nitrate would be the first salt to crystallize from solution rather than sodium and then aluminum nitrate.
The Aspen model showed that solubility is decreased with the addition of nitric acid, and that solubility increases with increasing temperatures.