INVESTIGATION OF TWO-PHASE FLOW IN FRACTURED ROCK
Lutz Liedtke and Hua Shao
Federal Institute for Geosciences and Natural Resources (BGR)
Hannover, Germany
Herbert Kull
Gesellschaft für Anlagen und Reaktorsicherheit GmbH (GRS)
Braunschweig, Germany
ABSTRACT
To characterize sites for the disposal of high-level radioactive waste in granite, BGR (Federal Institute for Geosciences and Natural Resources) and GRS (Gesellschaft für Anlagen und Reaktorsicherheit GmbH) have recently been concentrating on investigation of two-phase flow processes in fractured granites at the Grimsel Test Site in Switzerland and Äspö Hard Rock Laboratory in Sweden.
To understand tracer migration processes under two-phase flow conditions in fractured rock, tracer experiments on different scales have been conducted in the artificial fracture systems of the excavation-disturbed zone (EDZ) and in the natural fracture systems under both water-unsaturated and water-saturated conditions.
This paper shows the results of hydraulic tests carried out by BGR in fractured rock using gas (in this case air). They highlight how the capillary effect influences the determination of rock permeability and how the threshold pressure depends of on rock pore volume and fracture apertures in the fractured rock. The dependence of the tracer experiments on scale was studied using different conceptual models: the fracture network model and the double porosity model. Ventilation of tunnels and caverns is expected to lead to partial desaturation of the permeable rock matrix. GRS carried out tests to determine the two-phase flow properties and the extent of such partially desaturated zones. Evaporation and the resulting changes in the hydraulic flow field were studied using a two-phase flow model to simulate the test results.
Conceptual models, experimental methods, and 3-D numerical methods for modeling of two-phase tracer transport in fracture systems are planned to be developed further within the framework of international cooperation.
INTRODUCTION
According to German law, all radioactive waste in Germany must be disposed in final repositories situated in suitable geological formations that isolate them from the biosphere. Investigation programmes for different geological conditions have been performed during the last years in order to characterize the potential suitability for repository construction. The Federal Institute for Geosciences and Natural Resources (BGR) has performed a comprehensive geological exploration programme in the Gorleben salt dome as the potential repository site. In addition, BGR together with GRS (Gesellschaft für Anlagen und Reaktorsicherheit GmbH), supported by the Federal Ministry for Education, Sciences, Research and Technology (BMBF), are participating in international research programs in the Grimsel (Switzerland) and Äspö (Sweden) Hard Rock Laboratories.
Within the research programme at the Grimsel Test Site, extensive geological studies and two-phase flow tests as well as in situ hydraulic tracer tests have been carried out in fractured rock and in the near-tunnel field (Grimsel). A finite element program system was also developed to interpret the in situ experimental results and to model groundwater flow and tracer transport in the fracture systems. The geometric (fracture aperture, connectivity of fracture systems), hydraulic (local permeability, local storage coefficient and gas threshold pressure) and transport (flow velocity, effective porosity, dispersivity and diffusion coefficient) parameters have been evaluated using in situ and numerical experiments.
The purpose of this paper is to summarize the results from in situ experimental and numerical investigations and to pinpoint some phanomena which should be further investigated in the current project of two-phase flow experiment in the Äspö Hard Rock Laboratory.
TRACER TESTS IN FRACTURED ROCK
Characterization of the fracture systems and the understanding of flow and transport processes in the fractured rock are the important tasks in the assessment of a radioactive waste repository with respect to long-term safety. For this purpose different geoscientific methods have been used at the Grimsel Test Site.
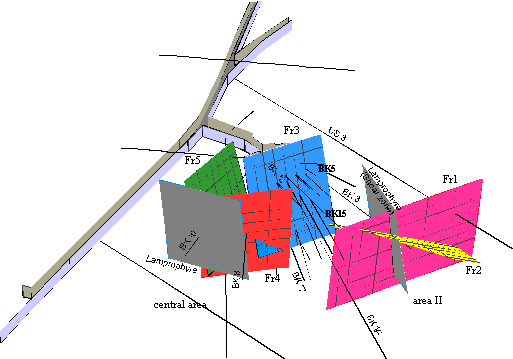
In the blasted cavern BK test area, more than 1000 m of cores have been drilled (Fig. 1a). Some major fracture zones have been detected [4] using


Fig. 1a-b Fracture model for Grimsel Test Site, b) numerical model and flow field in the tracer test (BK ans US are boreholes, and Fr means fractures.
Based on the data from the geological and hydraulic investigation, structural fracture models have been set up (Fig. 1a). Within the fracture systems there are two quite different hydraulic boundary conditions. In the central area (blue Fr3, red Fr4 and green Fr5 fracture zones), a hydraulic head of 10 bar was measured and the flow rate of 2.3 L/min was monitored continuously. In area II (yellow Fr2 and magenta Fr1 fracture zones), there is a hydraulic pressure of 40 bar, which is related to a water head of 400 m in the mountain. When the packer in borehole BK3 was opened, a flow rate of up to 2 L/min was measured under steady state condition.
Numerous tracer experiments [3, 4] are being performed in the major fracture zone, which has a high permeability. A dipole tracer test was performed in the blue fracture zone (Fig. 1a) with a distance of 10 m between boreholes BK5 and BK15 (VE520). This fracture zone was detected by the numerous existing boreholes, and can be described by a planar structural fracture system. Salt water with a concentration of 1.8 mS/cm as conservative tracer was injected into borehole BK5 for 4 days and the breakthrough time was observed in hole BK15 after several hours (Fig. 2a).
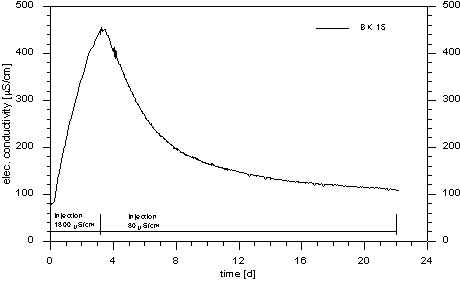
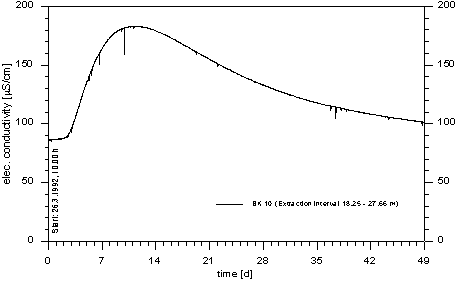
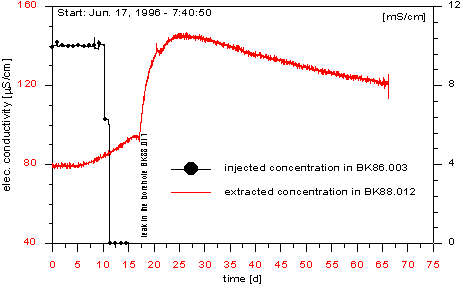
Fig. 2. a,b,c. Breakthrough curve in small scale tracer test, b) breakthrough curve in intermediate scale tracer test, c) breakthrough curve in large-scale tracer test.
The another tracer test [3] over a distance about 70 m between injection and extraction boreholes was performed between boreholes BK14 and BK10 (VE493). The pressure responses in all boreholes which penetrate to the fracture systems in the central area were observed parallel to the change of pressure in the injection hole during the pressure build-up tests. Quite a good hydraulic connection can be therefore inferred between the three fracture zones. Based on the knowledge of the hydraulics of the system, the tracer was injected into borehole BK14, and migrated through the blue and the magenta fracture zones, the lamprophyre, and then the green fracture zone to the extraction borehole BK10, where the first tracer arrived after 3 days (Fig. 2b).
During the hydraulic tests performed previously, no pressure response was detected in the central area when the pressure build-up tests were carried out in area II. It appears that two hydraulically independent areas exist without any connection. However, whether the fracture systems connect hydraulically with each other or not, cannot be determined by using hydraulic tests alone. Therefore a large scale tracer test was designed in the BK test area to detect the connectivity of the fracture systems and to characterize the tracer transport over a distance of over 100 m.
The test layout was optimized by numerical design calculations. Different structural-hydraulic fracture models have been analysed. A realizable test configuration, e.g. the amount of injected tracer and the duration of injection, was determined by varying the parameter values in the models.
Salt water with a concentration of 10 mS/cm was injected for 10 days into well BK3 under a hydraulic pressure of 50 bar, which was 10 bar more than the natural head. In the withdrawal hole BK12, the flow rate and salt concentration were continuously monitored. A quite constant withdrawal rate of about 2 L/min was observed. The first tracer arrived at the observation borehole after only 11 days. The breakthrough time (30 days) estimated by predictive modelling is possibly due to the existence of another, shorter pathway than was visualized in the model.
During the entire tracer test, groundwater samples were collected at the withdrawal well and measured for tracer content using two continuous sensors. The tracer test was terminated after a well-defined tracer breakthrough curve had been obtained. All data from the three tracer tests are summarized in Table I, as well as from a tracer test with a distance of about 2 m (VE730) in the microfracture system of the EDZ.
From the breakthrough curves displayed in Fig. 2, we can conclude that the transport of solutes in the fractured rock is scale dependent. Tracer migration is affected more by advection than by diffusion, especially over short distances of 5 - 10 m. Thus it is very important to determine the flow field correctly. In the large-scale tracer experiment, the diffusion capacity of the rock should be taken into consideration in order to model tracer transport reasonably. The longer 'tailing' in the breakthrough curve in the large-scale tracer test can be explained by channelling and diffusion in the fractured rock. Generally an average transport velocity can be obtained of about 10 m/d under natural hydraulic conditions. A locally variable hydraulic conductivity of
10-3 - 10-6 m/s, and porosity of 0.5 can be obtained using the numerical model. Fig. 1b shows the head distribution and flow field in the large-scale tracer experiment.
Table I. Tracer concentration and breakthrough time (BT)
|
Tracer Test No. |
Distance |
BT |
BT |
BT |
Peak Tracer Time [d] |
Ratio of Concentration Cmax/C0 [-] |
Comments |
|
VE730 |
2.0 |
1.14 |
29 |
117 |
- |
- |
micro fracture systems (EDZ) |
|
VE520 |
10.0 |
1.4 |
5.1 |
18.4 |
3.5 |
0.25 |
1 planar fracture |
|
VE493 |
70.0 |
5.8 |
19.4 |
49.6 |
11 |
0.018 |
> 3 fractures |
|
VE800 |
> 100.0 |
20 |
38.6 |
63 |
26.7 |
0.015 |
>3 fractures |
TWO-PHASE FLOW EXPERIMENT IN THE TUNNEL NEAR-FIELD
Within the investigation programme of the tunnel near-field, eight boreholes were drilled in two fans with different orientation in order to determine whether the geometry of the excavation damaged zone (EDZ) was asymmetric. The holes were 3 m long, 86 mm in diameter and 2 m apart.
Different methods were applied to characterize the EDZ [5]:
The existence of an excavation-damaged zone in the tunnel near-field was proved by different methods. Cross-hole and single-hole sonic and hydraulic measurements were correlated with the results of the structural mapping. In this way a fracture model of the microfracture system was built up.
In order to determine the fracture permeablity, air was injected into the fracture, which was isolated using a mechanical short-interval packer with a 10 cm injection interval in combination with a surface packer system, which served as observation interval. Using this special packer system, every open fracture in the EDZ can be hydraulically tested.
To interpret the in situ air tests, a numerical gas model based on the finite element method was developed jointly by BGR and Insitute of Fluid Mechanics of the University of Hannover. Finite elements of different dimension are used in the gas model to describe the complex geometry of the system [6]. For example, the volume of the borehole interval is descreted by three dimensional elements to consider the skin effect in the well test using a compressible fluid. The isotropic and heterogeneous properties of the rocks can be also considered using different material groups. The numerical evaluation of the air tests shows that the fracture permeability ranges between 10-10 and 10-15 m² (Table II).
Table II. Hydraulic weighting factor and permeability in the EDZ
|
Hydraulic Weighting Factor |
Fracture Aperture [mm] |
Permeability[m²] |
Comments |
|
W1 |
<0.1 |
<10-15 |
microfissures |
|
W2-5 |
0.1-0.5 |
10-14 - 10-15 |
fissures |
|
W10 |
0.5-1.0 |
10-13- 10-14 |
fissures visible |
|
W20 |
>1.0 |
> 10-13 |
failure zone |
During the air tests, the question arose as to how much the groundwater in the pore spaces influences air flow in the fracture system? In the EDZ area the pore-water content is lower due to long-term ventilation. Therefore the known fracture was water saturated artificially. High water saturation was reached after injecting water into the corresponding fracture interval for two months. Then the gas threshold pressure tests, in which air was injected under constant pressure step by step from 2, 4, 6, 8, to 10 bar, were carried out. For the fracture with an aperture of > 0.1 mm and a permeability of 5´ 10-13 m², the air entered the saturated fracture with no problem, indicating that no threshold pressure exists in this case. In contrast to this test, no air entry was recorded in the fracture with an aperture of < 0.1 mm and a permeability of 2´ 10-15 m² at an injection pressure of under 6 bar (Fig. 3a).
The threshold pressure is dependent on the fracture aperture and hydraulic boundary conditions around the fracture. An empirical explanation using the cubic law shows that the threshold pressure amounts to less than 20 bar in the fracture area and may be more than 40 bar in the matrix area (Fig. 3b).
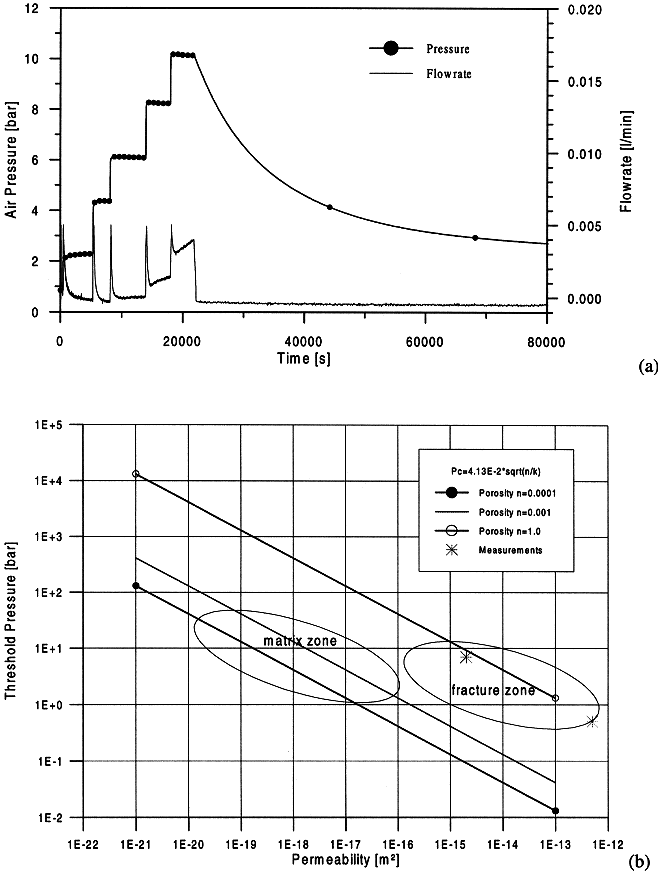
Fig 3a-b. Gas threshold pressure test in the EDZ, b) correlation of threshold pressure and permeability.
DESATURATION EFFECTS IN THE ROCK MATRIX
Modelling studies have shown that ventilation of tunnels can lead to partial desaturation of the rock matrix [2]. As the tunnel near-field is partially gas saturated, the water flow field will be affected. In oder to quantify the effect, a series of hydraulic measurements were performed in a homogeneous rock volume of granodiorite to a depth of 2.5 m from the tunnel surface. The influence of desaturation on pressure evolution and the hydraulic gradient and the extent of the zone of influence were investigated in a dense network of slim boreholes (Fig. 4). The tests were run under controlled climatic conditions in a closed ventilation chamber. Corresponding to in situ measurements, the time-dependent desaturation was simulated using a one-dimensional two-phase flow model [1].
Curve No. 1 in Figure 4b represents the initial pressure distribution under quasi-stationary conditions at the beginning of the tests. Already 10 cm behind the tunnel wall, the water pressure increases to 100 kPa over atmospheric pressure. The form of the pressure curve supports the assumption of a homogeneous rock volume. No hydraulic features characterized of an enhanced transmissivity, e. g. brittle deformations, were recognized, neither were there any indications of an excavation damaged zone.
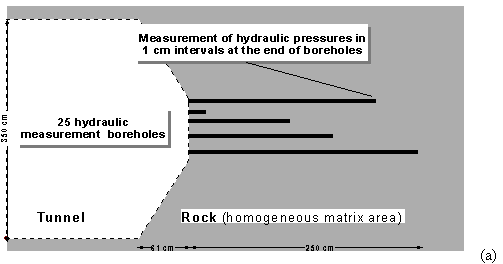
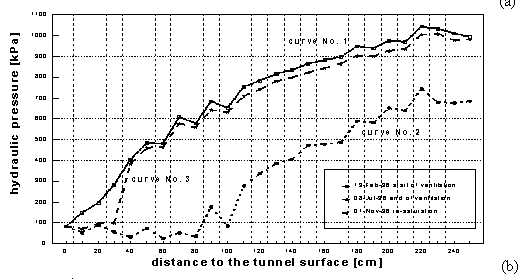
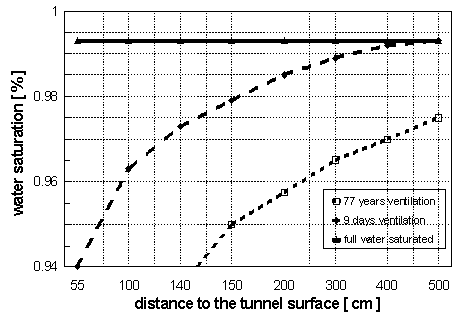
Fig. 4a-b-c. Configuration of hydraulic pressure measurements, b) pressure distribution in tunnel near-field at different stages of ventilation and c) calculated desaturation of right porous media for different ventilation times on the basis of two two-phase flow relationships: capillary pressure vs. saturation and relative permeability vs. saturation.
Curve No. 2 shows the water pressure after 5 months of constant ventilation. The decrease of the relative humidity in the chamber caused an 'underpressure zone' (hydraulic pressure below atmospheric pressure), due to the high capillary forces in the rock. At 40 cm from the tunnel surface the hydraulic pressure was approximately 50 kPa below atmosphere. In this zone, which has a depth of 1.0 m, the hydraulic gradient changed direction.
When ventilation ceased, the hydraulic pressure increased again until it reached the initial head. Curve No. 3 represents the hydraulic pressure distribution 4 months after starting the re-saturation phase. The partially desaturated zone seems to be limited to the first decimetre of the tunnel surface.
An example of the results of modelling ventilation effects in porous media is given in Figure 4c. It underlines the conclusion that desaturation only occurs in the vicinity of the tunnel surface and that the absolute gas content is in the range of about 10% pore volume. Simulation of the evolution of a desaturated zone over 77 years yields a penetration depth of about 1 to 2 m.
CONCLUSIONS
A series of in situ tracer experiments have been successfully completed in a quasi dipole test configuration within the fracture systems at the Grimsel Test Site. Salt water with a low salt content, which is a conservative tracer, was used in the tests , because its concentration can be recorded electronically. The breakthrough curves for the different transport distances show different characteristics of the transport phenomenon, which could be explained by different conceptual and numerical models. In the small scale experiment, the fracture network model can be used and in the large scale experiment a double porosity model, which takes both the diffusion effect and channeling into consideration, was applied to interpret the tranport processes.
All of these models were based on water-saturation conditions. Actually, two-phase flow conditions may develop in the rock formation surrounding a repository because gas may be released from several sources, e.g. corrosion, bacterial activity, exsolution of gas dissolved in the groundwater due to a decrease in pressure, and entry of gas into the rock formation from ventilated tunnels. Quite different transport processes may be active under two-phase flow conditions than under one-phase flow conditions, because two phases occupy the voids in a permeable material. Pores and fractures occupied by one phase are unavailable for flow by the other, and each phase interferes with the flow of the other, thus reducing the effective permeability for the other phase. Another aspect is that gas, which is also a medium for contaminant transport and follows pressure gradients, may change the transport processes of solutes following major flow paths along fractures to the groundwater table.
Therefore tracer migration under two-phase flow conditions will form the major topic of study in a joint project between BGR, GRS and SKB (Sweden) at the Äspö Hard Rock Laboratory.
REFERENCES
1. GRAEFE, V. (1997): Zweiphasen-Strömungen von Wasser und Luft in der Umgebeung eines Stollens in porösem Hartgestein.- GRS - 143, Köln.
2. KULL, H. & MIEHE, R. (1995): Grimsel Test Site - The influence of tunnel ventilation on the hydraulic flow conditions in the crystalline rock zone in the tunnel nearfield.- Technical Report 94-04E, Nagra, Wettingen/Switzerland.
3. Liedtke, L., Götschenberg, A. Jobmann, M. & Siemering, W. 1994: Experimentelle und numerischen Untersuchung zum Stofftransport in geklüftetem Fels, NAGRA NTB 94-02E, Wettigen, Switzerland
4. Pahl, A., Liedtke., L., Naujoks, A. & Bräuer, V. 1992: Fracture system flow test, Nagra Technischer Bericht 91-01E, Wettigen, Switzerland
5. Sönnke, J. Shao, H. & Bräuer, V. Oct. 1997: Influence of the Excavation Disturbed Zone (EDZ) on Rock Mechanical and Hydraulic Properties of the Tunnel Near Filed, in 4th International Workshop on Design and Construction of Final Repositories, Luzern, Switzerland
6. Shao, H., Kolditz, O. & Zielke, W.: Gas Flow in Hard Rocks: Model Verification and Application to the Interpretation of Shut-In Tests, Report, Institut für Strömungsmechanik of Uni. Hannover, 1996.