ANALYSIS OF THE DWPF GLASS POURING
SYSTEM USING NEURAL NETWORKS(U)
T. Bond Calloway, Jr. and Carol M. Jantzen
Westinghouse Savannah River Company
Savannah River Technology Center
Lynn M. Medich and Nicholas R. Spennato
Pavilion Technologies, Inc.
Austin, TX 78758
ABSTRACT
Neural networks were used to determine the sensitivity of 39 selected Melter/Melter Off Gas and Melter Feed System process parameters as related to the Defense Waste Processing Facility (DWPF) Melter Pour Spout Pressure during the overall analysis and resolution of the DWPF glass production and pouring issues. Two different commercial neural network software packages were used for this analysis. Models were developed and used to determine the critical parameters which accurately describe the DWPF Pour Spout Pressure. The model created using a low-end software package has a root mean square error of +/- 0.35 inwc (< 2% of the instrument's measured range, R2 = 0.77) with respect to the plant data used to validate and test the model. The model created using a high-end software package has a R2 = 0.97 with respect to the plant data used to validate and test the model. The models developed for this application identified the key process parameters which contribute to the control of the DWPF Melter Pour Spout pressure during glass pouring operations. The relative contribution and ranking of the selected parameters was determined using the modeling software.
Neural network computing software was determined to be a cost-effective software tool for process engineers performing troubleshooting and system performance monitoring activities. In remote high-level waste processing environments, neural network software is especially useful as a replacement for sensors which have failed and are costly to replace. The software can be used to accurately model critical remotely installed plant instrumentation. When the instrumentation fails, the software can be used to provide a "soft sensor" to replace the actual sensor, thereby decreasing the overall operating cost. Additionally, neural network software tools require very little training and are especially useful in "mining" or selecting critical variables from the vast amounts of data collected from process computers.
INTRODUCTION
The Defense Waste Processing Facility, located on the DOE owned Savannah River Site, near Aiken, SC is currently treating and immobilizing high-level nuclear waste generated during the production of nuclear weapons materials for the Department of Energy. After more then a year of radioactive operations (April 1996 to Nov. 1997), the DWPF has produce approximately 263 canisters (as of 12/17/97) of high-level radioactive waste that has been vitrified into a durable borosilicate glass. The DWPF uses the vitrification process to effectively immobilize the waste in a glass matrix. A Joule heated melter is used to melt the waste and borosilicate glass frit slurry. A differential pouring control system is used to pour the melted waste glass into a stainless steel canister. The differential pressure between the melter plenum and the melter pour spout is controlled using a combination of a liquid jet pump and plant air to maintain a negative differential pressure between the melter pour spout and melter plenum. The change in differential pressure changes the liquid level in the melter causing the glass to overflow through the melter riser and pour spout and into the canister. A simplified diagram of the glass pouring system is shown in Figure 1.
Fig. 1. Simplified DWPF Glass Pouring System Diagram
The glass pouring system is a relatively small but important part of the DWPF Melter, Melter Off Gas, and Melter Feed system. The entire Melter, Off Gas, and Feed system includes over a hundred variables which are used to monitor and control the process that vitrifies the slurry/frit mixture, pours the waste glass into a canister, and quenches and filters the off-gases from the melter and glass pouring system. The DWPF Melter, Melter Off Gas, and Melter Feed system is closely coupled to the Pour spout via the Melter plenum and melt pool. Therefore, a change or process upset in the DWPF Melter, Melter Off Gas, and Melter Feed system will impact the ability of the glass pouring system to control a stable pour stream.
Neural computing is applicable in any situation where there is an unknown relationship between a set of input process parameters and an outcome, and for which a representative set of historical examples of this unknown relationship is available. Neural networks can be used to model complex processes from actual process data collected in the plant. Neural networks are especially useful in "mining" or selecting the critical variables from a large set of collected process parameters and determining which parameters have the most impact on the modeled variable(s). Additionally, neural network models and analysis, depending on the software involved, can be performed in a number a hours and do not require a large amount of training to be effectively utilized. Neural networks and empirical modeling software also can be used to predict and control processes. [4]
The modeled variable, selected for this analysis, is the Melter Pour Spout pressure (PI3527). The objectives of this study follow:
It was not the objective of this study to compare one company's software package versus another, although some comparison is necessary to aid the further application of these technologies. Both high-end and low-end software packages were selected to determine what range of products were available.
DISCUSSION
Software Selection
The NeuralWare Predict software was chosen for its low cost (<$3000) and relatively easy to use interface. The NeuralWare Predict software integrates with Microsoft's Excel software. The Predict package is a low-end neural network package which is used for modeling and data analysis. NeuralWare also manufactures high-end neural network software packages which are used for process control applications. The Predict software package operates with Excel as a user interface, the package is limited to about 16,000 rows of data. Predict does have a command language which allows more lines of data to be entered into a batch file. However, this feature requires additional training, and it is not clear from the manuals how this feature would be employed.
Pavilion Technologies Process Insights also was selected because it was specifically designed to handle large amounts of data (>16,000 rows) in a spreadsheet format. Additionally, Process Insights also was selected because the software was designed with a user interface that would allow direct application in a plant. Process Insights is a high-end neural network software package ($50,000 - 100,000) which has all the features of the low cost Predict package but can also be used for process control applications. As expected, Process Insights provides more sophisticated and easier to use data entry, modeling, and data analysis tools. Pavilion's software is designed to be used for analysis, prediction, and control of process parameters on-line in a plant control room or at engineering work stations. Additionally, Process Insights allows the engineer to easily select the optimal set points for the process as if he were actually at the controls of the real process. Additionally, since Pavilion's software is primarily used by the commercial industries, the software allows direct calculation of return on investment as prior to implementing the software in the plant. The NeuralWare company also makes a high software package that is similar to the Pavilion product.
Both packages are designed to be used by process engineers. Other empirical modeling and analysis tools have been utilized by the Westinghouse Savannah River Technology Center [3].
Data Processing and Modeling
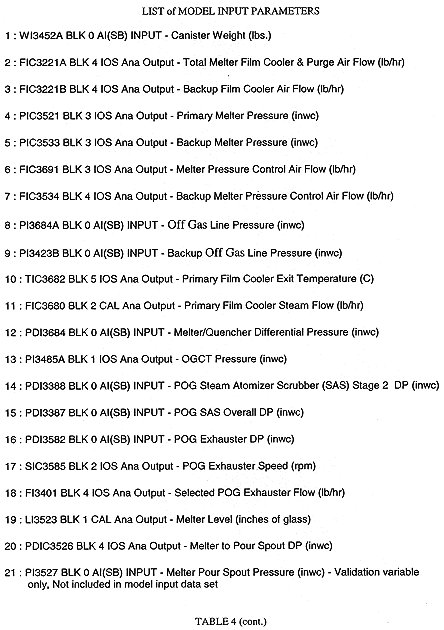
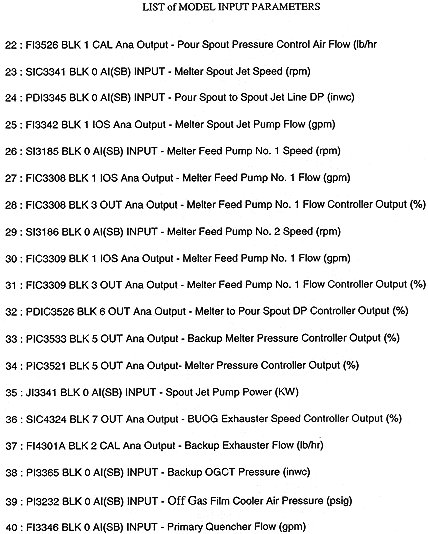
Process data used in the modeling process was obtained from the DWPF Melter Off Gas Data Acquisition program. The data acquisition program was created during the initial startup test phase of the Melter Off Gas system. The program is used for transient event analysis, process troubleshooting, and performance monitoring. The program currently collects 40 Melter/Melter Off Gas and Melter Feed system parameters (see Table 4, Appendix A). These parameters were selected independently by previous engineering personnel. The Melter Off Gas data acquisition system was modified to collect data on a continuous basis. Currently, six months of on-line storage capability is available for the collected data. The data collected is raw process data and is not altered to make the data easier to store. That is, each data point is collected from the DWPF Distributed Control System (DCS) Process Control Module (PCM) on a predetermined frequency (once per second) and stored in a text file. Commercially available software is used to extract and import the files into Excel. In the case of the Process Insights model, raw unformatted ASCII text files were sent directly to Pavilion Technology, Inc.
Data (» 15,000 rows) from canister S00430 was selected for analysis using the Predict software. The data from canister S00430 was selected since this canister was the first in a series of approximately 20 radioactive canisters poured without any reported interruptions due to pour stream anomalies (wicking). The data used represents glass pouring operations from initial break over through Melter deinventory and includes continuous feeding and pouring operations. No pour stream anomalies were reported during this canister, and the canister was filled without interruption of Melter feeding or pouring operations. In the case of the Process Insights model, 17 days (» 1,500,000 rows, 100 megabytes) of data were sent to Pavilion. The Pavilion data set represents pouring and non-pouring operations. It is important to point out that the Pavilion model is expected to be more accurate than the model created using Predict software because the data set for the Pavilion software is much larger than the data set used for the Predict model.
Once the data is loaded into Excel, the Predict software requires the user to define which process parameters are inputs and which are outputs. The output selected for both the Predict and Process Insights models was PI3527, Pour Spout Pressure. Multiple output models can also be created using Predict and Process Insights. The inputs for the both models were the other 39 inputs listed in Table IV.
The Predict software uses several default neural network modeling parameters to build a neural network model. Since part of the purpose of this study was to determine the ease of use of the software as well as the accuracy of the model, several attempts were made to improve the model by modifying the default parameters. Predict is a Windows based software and allows the user to easily modify all neural network parameters using a point and click method. However, the overall accuracy and correlation of the predicted values to actual plant data could not be improved significantly using values other than those suggested by the Predict software. Based upon the accuracy of the model created for this study, the default parameters are suggested for most process engineering applications in DWPF.
Data is loaded into the Pavilion software in much the same way as the Predict software. However, a larger data set can be loaded directly into the software without the use of special programs. Additionally, data collected during process downtimes can more easily be edited from the data set. Pavilion can be purchased as a Windows 95/NT based program and operates using a point and click method.
Once the inputs and outputs are defined, the Predict software requires approximately 2 hours to model the Pour Spout Pressure using a 39 column by 15,000 row input file. A 16 MB ram 100 MHz Pentium (Windows 95) computer was used for this effort. Higher speed computers will significantly decrease this time. However, the two hours of time required is considered to be insignificant when compared to the man-months required for a model based upon a first principals approach. Process Insights requires at least 166 MHz Pentium, and the processing time will vary based upon the size of the data file.
Once the model is completed, a standard set of analysis tools are included in the Predict and Pavilion software packages which allow the user to test the model against new data and determine which variables have the most significant contribution to the model and potentially the process.
Model Analysis
The Predict software automatically reserves portions of the process data set for training and independent testing of the model. Table I and Figure 2 outline how well the model predicted the Melter Pour Spout Pressure. Table I lists the R, Net R, Avg. Absolute Error, Max. Absolute Error, RMS (Root Mean Square) Error and Accuracy.
The sign of the contribution value is not considered to be significant for a single output model. [2] Table I was created automatically by the software which significantly reduces the time evaluating the validity of the model.
Fig.e 2. Predicted Pour Spout Pressure vs. Actual Pressure for Canister 430
Table I. Canister 430 Model Prediction Compared to Plant Data
The R measure and RMS error, 0.88 and 0.35 inwc, respectively show that the model accurately predicts pour spout pressure. The cause for the high maximum absolute error between the model and real world process data is not known at this time. This error could be reduced by using a larger data set for the model. However, significant deviations from the model may be indicative of a process or equipment problem. Analysis of Figure 3 reveals that other process parameters such as Melter Pressure (PIC3521) and Melter to Pour Spout Differential Pressure (PDIC3526) are probably not the cause of the deviation recorded by Pour Spout Pressure Indicator (PI3527).
Fig. 3. Predicted Pour Spout Pressure vs. Actual Pressure for Canister 430
Figure 4 is a plot of the model generated values (Y axis, Pressure, inwc) against the actual process data (X axis, Pressure, inwc). Units are in terms of inches of water column. The plot was generated using the Process Insights software package. A perfect model (R2 = 1) would depict a straight line. Models with good generalizations will have most, if not all, points within three standard deviations from the line through the center of the data. The three standard deviation lines are shown on the diagram in Figure 4. The Process Insights model determined the multivariable relationships with PI3527 to R2 of 0.969. As illustrated, the majority of the predicted values fall within three standard deviations of a perfect model.
Fig. 4. Pavilion Model Predicted vs. Actual Scatter Plots
Figure 5 shows an overlay of the original data and the model predicted values for PI3527 (Y axis, inwc) plotted with time (X axis). The plot is a general depiction of the fidelity of the model. As illustrated, the model was able to accurately predict PI3527 in ranges from - 7 to -11 inches of water corresponding to the common nominal operating ranges seen in the historical data.
Fig. 5. Pavilion Model Predicted vs. Actual Overlays
Contribution and Sensitivity Analysis
Neural network software provides the ability to rank or weight the variables selected by the software during the model building process. The Predict software provides a contribution analysis tool that ranks each input record with a value ranging from -100 to +100. A value of ± 100 is assigned to the field that had the most pronounced effect on the output for the current record. This contribution can be thought of as the additional impact the field has on the model, as compared to if the field were missing from the analysis. A value of zero is assigned to records that do not contribute to the model. Contribution values may have a positive or negative sign. The sign of the contribution value is not significant in single output models.[2]
The Process Insights software provides a sensitivity report which gives a rank-ordered listing of the importance of the variables used as inputs to the model. Since the Process Insights model was created with a larger data set, and hence provided a more accurate model, the variables listed in Table II can be considered to be a more complete and accurate list than the list calculated by the Predict Model (Table III). It is expected that since both neural network products are based upon a back propagation algorithm, a similar solution would be obtained with the Predict software provided the data set was large enough.
It is important to point out that both models correctly selected the primary controller, Melter to Pour Spout DP PDIC3526, as the most important variable affecting pour spout pressure. Since PDIC3526 is accurately described by other variables selected by the Process Insights model (e. g. Pour Spout Pressure Control Air, FI3526), this variable was deleted from the list without compromising the Process Insights model's accuracy. Sensitivity is calculated by taking the distribution-average sum of the partial derivatives of the neural network input-output pairs.
Table II. Sensitivity Report for Pour Spout Pressure using Process Insights Model
Table III lists the average contribution of all the variables selected by the Predict neural network model. The average contribution was calculated using Excel to average the absolute contribution values calculated for each individual input record. The contribution gives a relative weighting of the selected variables based upon the overall effect of the individual variable on the output of the model.
Table III. Contribution Analysis for Canister 430 Pour Spout Pressure Predict Model
Several of the variables that were selected by both models were evident. These variables could have been determined from a simple analysis of a piping and instrument diagram of the system. The differential pressure between the pour spout and the melter (PDIC3526, item 1, Table III), the differential pressure controller output (PDIC3526, item 6, Table III), and Pour Spout Pressure Control Air (FI3526, item 3 Table II & V Table III) are all directly related process variables which control or indicate the differential pressure in the Melter Pour Spout. Additionally, Melter pressure (PIC3521, item 4 Table II & Item 7, Table III) which was selected by the model, is directly related to the pour spout pressure controller via a differential pressure leg (See Figure 1).
The Melter Spout Jet Pump Flow FI3342 is the vacuum source for the Melter pouring control system. Normally, the spout jet pump flow is assumed to be constant in most short time domain analyses; however, given a larger data set, the pump performance is found to change significantly with changing level in the Off Gas Condensate Tank (e.g. during pump out of the tank).
The Primary Off Gas Quencher FI3346 and Off Gas Condensate Tank Pressure PI3485A can affect the pour spout pressure by changing the pressure in the melter or at the spout jet outlet. These variables were previously thought to have little if any affect on the pouring control system. These variables most likely affect the pouring control system by shifting the operating or control plane of the system. Analyses using small data sets (e.g. Predict Model, historical trend graphs) show these values to be nearly constant. However, given the larger size of the data set used in the Pavilion model, allowed it to be shown that these parameters may have an impact on pour spout pressure.
Also, Melter level, LI3523, Melter Feed Pump speed, SI3185 and Melter Feed Pump Flow, FIC3308, were not considered to have an effect on the Melter Pour Spout Pressure until this analysis was performed. The Melter Feed Pump speed, which relates directly to mass flow into the Melter, impacts the mass flow out of the Melter as well as the plenum pressure in the Melter. Mass flow into the Melter was independently shown to have an effect on Pour Spout pressure using frequency analysis conducted with Techmation's Protuner control loop tuning software. Additionally, changes in contribution may be significant when coupled with a change in the real world process (e.g., setpoint change-See Fig. 8, level increase). Figure 6 shows the effects of changing level on contribution.
Fig. 6. Contribution Analysis (Actual Melter Level vs. Contribution)
Figure 6 shows that rising Melter Level increases the contribution of level to the model of the Melter Pour Spout Pressure. DWPF historical trend graphs for 11/10/96 - 11/11/96 of Melter level were compared to similar trends of Melter Level from earlier in June/July 1996. The comparison shows that for canisters which did not have any reported pour stream anomalies (wicking), melter level was gradually increasing as the canister was filled. This increase in level is currently believed to be caused by an increase in thickness of unmelted slurry (cold cap), which causes an increase in head pressure which in turn translates to a higher glass level in the riser during the pour. This increase in level may offset the variability in the Melter feed flow and Pour Spout differential pressure caused by the controller and system induced (noise) oscillations.
However, the buildup of unmelted material on the glass or the buildup of a foam layer on the Melt pool may lower the effective density of the total pool which is in turn seen as an increase in the Melter level indicator. This level indicator is not density compensated. Additionally, a decreasing density in the melt pool also will occur as melt pool temperatures stabilize at higher values after an equilibrium Melter level is reached during the pour.
The Process Insights model also determined that Melter level influences pour spout pressure. Figure 7 is a plot that shows the model calculated values of PI3527 on the Y axis with the range of input variables depicted in 5 % increments on the X axis. This plot is a slice through the multi-dimensional response surface Compared to the other inputs, Melter Level, LI3523, has the largest effect on PI3527 over its operating range (of the data included in the model). Figure 7 also indicates that LI3523 has a nonlinear effect on PI3527 with all other variables held at their respective averages. The point at which the lines intersect aids the user in determining the optimal set points for the respective parameters.
Fig. 7. Plot showing the model calculated values of PI3527.
Trending of the contribution values for the various process parameters selected by the model reveals that the contribution changes with a change in system pressure. Figure 8 and 9 show examples of this change. This analysis indicates that the contribution of various process parameters selected by the model may shift in importance as the process shifts to different control points.
Fig. 8. Contribution Analysis (Melter Air System Pressure vs. Pouring Controller)
The Backup Exhauster flow also was identified as a contributor to the control of Pour Spout pressure. The Backup Melter Off Gas system is tied to the pouring system via a three-way valve which normally isolates the Backup Off Gas system from the pouring system (see Figure 1 - MOV3340). Slight air in-leakage could be occurring through this valve which would subtly influence the variability in the Melter Pour Spout pressure.
Fig. 9. Contribution Analysis (Melter Feed Pump No. 1 Speed vs. PDIC3526)
Potential Application Radioactive Waste Processes
In remote high-level waste processing environments, neural network software is especially useful as a replacement for sensors which have failed and are costly to replace. The software can be used to accurately model key remotely installed plant instrumentation. When the instrumentation fails, the software can be used to provide a "soft sensor" to replace the actual sensor, thereby decreasing the overall operating cost. Additionally, neural network software tools require very little training and are especially useful in "mining" or selecting critical variables from the vast amounts of data collected from process computers. The safety aspects of operating with a virtual sensor would need to be addressed prior to implementation in a plant
The DWPF melter is currently operated by manually adjusting the power output to the melt pool electrodes. Small adjustments made by the operator are not transmitted into a change in temperature until several hours later; depending on the magnitude of the change. Neural network software such as the package discussed below can be used to predict where the process is headed several hours before an alarm condition is reached. The predictive model used in this application is a "soft sensor" or "virtual sensor" model. The virtual sensor is especially useful in the DWPF Melter system since the Melter Thermowell, which is used to control the temperature of the melt pool, costs in excess of $100,000 to replace. Additionally, the thermocouples, which are also used to control the melter temperature, cannot be replaced (e.g. riser and pour spout). Both NeuralWare and Pavilion make products which can be used for this application (e g. Process Insights & NeuCop II)
The DWPF has a highly integrated ventilation system which is used to contain airborne radioactive particulate inside the DWPF and away from the environment and operating personnel. This system consists of three separate ventilation zones, and has over 50 supply and exhaust fans. Additionally, over a hundred variables are used to monitor and control the ventilation process which filters and contains the radioactivity within DWPF. Small changes in this system can results in cross contamination between ventilation zones. Neural networks can be used to "mine" the important parameters from the historical data and thereby concentrate engineering and maintenance resources on the parameters which most influence the operation of the system.
Weeks has shown that neural network technology can also be used to determine when a sensor is failing before the sensor has failed [3]. Failure analysis applications can be applied to multiple process systems at DWPF. Failure analysis is broadly applicable to DOE radioactive waste processes.
RESULTS-SUMMARY
CONCLUSIONS
Commercial neural network computing software was used to determine which parameters currently being monitored by DWPF were potentially influencing the pour spout pressure.
The neural network software is a valuable and cost effective tool which can be utilized by the process engineer in the determination of all the significant parameters affecting the process units performance. Accurate models can be built in a fraction of the time required for a first principles model.
Neural network technology is broadly applicable to radioactive operations conducted at DOE facilities and, may be employed in many situations to maintain safe operations and reduce overall operating and maintenance costs.
ACKNOWLEDGMENT
This paper is a tribute to the many individuals who worked to make radioactive operation of DWPF a reality. This paper was prepared in connection with work done under Contract no. DE-AC09-96SR185000.
REFERENCES
APPENDIX A
Table IV. List of Model Input Parameters