
SIMULATION OF WATER DIFFUSION IN PACKED HULLS
I. Tovena
CEA Cadarache
13108 St-Paul-Lez-Durance, France
Phone:04-42-25-73-45, Fax : 04-42-25-49-39
L. Decker, D. Jeulin
CMM
Ecole Nationale Supérieure des Mines de Paris
77305 Fontainebleau Cedex, France
J. POCACHARD
CEA Grenoble
38054 Grenoble Cedex 9, France
ABSTRACT
The purpose of this study is to estimate the diffusion coefficient of water in packed hulls from a three dimensional image of this medium.The main characteristics of this media are more than 35 % of void and simulated compacted tubes in zircaloy 4.
The algorithm used to assess the transport properties is based on a random walker method.These results are compared with experimental measurement of the diffusion coefficient of tritiated water.
INTRODUCTION
Immobilization of radioactive hulls has been ensured by appropriate cement encapsulation. This conditioning is, however, not cost effective because of the resulting waste volume increase.
Nowadays, an alternative conditioning process is based on mechanical compaction for low density metallic scrap, almost completely composed of empty and thin walled tube sections.
Press compaction is very efficient; densification up to 70 % of the theoretical density of the component materials can be accomplished.The pellets obtained will, then be stored in a container, prior to a deep storage.
In the storage conditions, after the total corrosion of the container, the major factor for dissemination of the radionuclides to biosphere is underground water.
In order to model the long term behavior of the radionuclides in deep storage, a better understanding of the phenomenology of water transport into these packed tubes is necessary.
Therefore, experimental measurements of tritiated water diffusion in packed inactive hulls were performed and compared with the modeled one. This last modeling is based on a morphological approach.
EXPERIMENTAL DATA
Pellets Compaction
Tubes of zircaloy 4 have been cut into chops of about 25 mm in length. Three small scaled compaction tests have been performed. The characteristics of these three super-compacted waste pellets (G1, G2, G3) are summarized in Table I.
Table I. Physical characteristics of three super compacted waste pellets (G1, G2, G3)
G1 |
G2 |
G3 |
|
Case |
white iron |
white iron |
white iron |
height (mm) |
216 |
216 |
216 |
diameter (mm) |
108 |
108 |
108 |
mass (g) |
456 |
454 |
454 |
Tubes |
Zircaloy 4 |
Zircaloy 4 |
Zircaloy 4 |
mass (g) |
1401 |
1402 |
1404 |
Hydraulic press |
|||
parameters |
|||
pressure (MPa) |
200 |
200 |
200 |
height press (mm) |
37 |
37 |
36.5 |
diameter (mm) |
111.2 |
111.2 |
111.2 |
Pellets description |
|||
initial value (l) |
0.39 |
0.39 |
0.39 |
compacted pellet (l) |
0.33 |
0.33 |
0.23 |
density pellet (kg/l) |
4.24 |
4.24 |
4.25 |
Ratio (%) apparent density / theoretical density |
65.24 |
65.24 |
65.33 |
G3 was used for the morphological study while G1 and G2 were used for the diffusion experiments.
Diffusion Experiments
Two comparative tests were carried out for the measurement of the tritiated water diffusion coefficient.
The difference is in the sample preparation. Before the diffusion experiments, G2 is prehydrated whereas G3 is not.
The diffusion coefficient of tritiated water in the pellet is measured in the cell represented in Fig 1.
After every sampling, the whole solution in the downstream compartment is collected and measured. For the dosage, 3H, b transmitter, is analyzed by liquid scintillation (PACKARD apparatus). Counting time is 60 minutes.

Fig. 1. Diffusion Cell
Evaluation of the effective diffusion coefficient must be done in permanent region which requiresa certain time of experimentation (almost six months).
Mathematical Morphology
Acquisition of 2D Images
A pellet was cut in slices of 2 mm in thickness. For each slice, a photograph was taken: 53 rectangular sections were thus obtained.
Conventionally, the x axis is the horizontal one in the length of the pellet while the y axis (vertical) is along the compression axis and the z-axis is the cut axis.
These photos were scanned in 256 grey levels, format 1000 x 900 to 2300 x 900 pixels which represents 100 Mb data, and therefore high precision (Fig. 2).
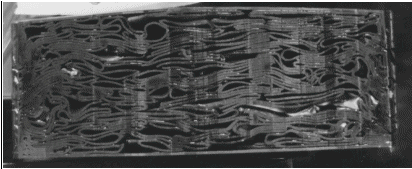
Fig. 2. Grey Level Image : Section z = 20 of the studied pellet
Each voxel represents 0.05 real mm in the x and y-directions and 2 mm in the z-direction.
Preliminary Treatment and Drift Correction
During the cut and photo sessions, the image of the surfaces presents a slight drift, which must be removed in order to match successive sections and to rebuild the 3D volume. The 3D minimal image obtained has a size of 1436H633H35 voxels.
Porosity Location
Because the transport properties are highly dependent on the porosity of the material, the characterization of the pore network is one of the most essential steps of the segmentation. Image analysis by mathematical morphology was performed on the 2D photos to determine the porosity of the compacted waste material.
This segmentation process consists in transforming the grey levels (brightness) into binary values (1 for the presence and 0 for the absence of solid in each pixel).
The method used combines two operations : a basic threshold which detects only the large and dark pores and a morphological transformation called top-hat [1,2], designed to detect the thin and long-shaped pores. The top-hat operation is followed by a threshold, but also by a binary filter which eliminates noise, namely a closing by reconstruction.
The result of such a segmentation is presented in Figure 3.
3-D geodesic propagation [3, 4, 5] simulates a fluid propagation in a porous medium. It calculates a geodesic distance (length of the shortest path through the porosity) from a given set of voxels, namely the source of the propagation to every voxel of the 3D sample.
A graph built on the cubic grid (every voxel having six nearest neighbors) was used to perform the calculation. Access to voxels located inside the matrix is obviously forbidden.
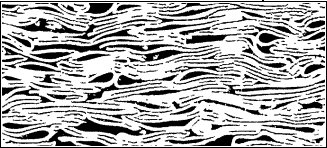
Fig. 3. Pore Detection for Section z = 20 (Centered Part Included in the 3D Minimal Image)
The algorithm used presents the advantage of being based on hierarchical queues [6, 7], and has thus proven to be very efficient.
This simulation is used to estimate :
Measurements of the Diffusion Coefficients : Random Walks
The characterization of the porous medium is achieved by simulating the average behavior of a fluid in it : the random walks technique is based on the free movement of particles in the pores, which are locally bounced on solid obstacles.
A population of N particles is uniformly distributed in the open porosity near the center of the pellet. Practically, about 10000 particles with initial coordinates (xo, yo, zo) at time to = 0 are randomly chosen in the intersection of the porosity and an ellipsoid of axes rx = 300, ry = 100 and rz = 3.
For each iteration, a random selection of the new location of a particle is made according to the following probabilities, given here only for the x coordinate, eq.1.(similar formulae are used for the y and z coordinates).
| (1) |
 |
As a result, a particle has 26 possible unitary moves or stays fixed with the probability Pox Poy Poz.
The entire trajectory of each particle is then recorded until a given time Te = Tmax is reached, unless the particle leaves the studied domain, with a life time Te < Tmax
The average speed vi of one particle i during its trajectory ending at time Te can be estimated from eq.2.
(2) |
The average speed of the whole population of particles is then deduced from eq.3 and can be calculated as eq.4 for a random walker in a homogenous medium
| (3) | |
| (4) |
The residence time method [8] gives an estimation of the diffusion coefficients D
x, Dy, Dz for each direction.The residence time T
a for one particle is its life time in the 3D medium before reaching a given side at a distance a from its initial average position. To measure these residence times, we have to make sure that Te is always equal to Ta < Tmax, with x(Ta) = a. In the present case, a drift is added to the movement of the particles in the x direction so that all of them end their trajectory for x(Ta) = a. More precisely stated, the new probability for movement is px' = px + eThe distribution function of the residence times is done eq.5.
| (5) |
|
When the effective drift is strong enough, P[X(t)
$ a | t $ Ta] . 1 and it can be shown that eq.6. and 7.
|
|
| (7) |
|
where |
|
The effective diffusion coefficient Dx is then deduced by adapting the theoretical distribution to the cumulative histogram of residence time coming from the trajectory simulations of thousands of particles. This approach is valid when the macroscopic behavior of the porous medium follows Fick's first law of diffusion [9]. A more complete approach will be presented in a forthcoming paper [10].
EXPERIMENTAL RESULTS
Diffusion Coefficient Measurement
Under the concentration gradient, the isotopes will naturally flow through the pellet from compartment A to compartment B. The diffusion process can be divided into two regimes. The unsteady-state regime corresponds to the slow drift of the isotopes from the upstream compartment to the downstream one. If the isotopic concentration in both compartments is kept constant, the flow of isotopes in the downstream compartment will reach a steady state.
The diffusion flow Ji of a molecular species in an ideal solution can be expressed in terms of the well known Fick's first law, eq.8 [9].
(8) |
Di : diffusion coefficient for the i-element,Ci : i-concentration
Since the law of mass conservation applies to any mass transport process, the Laplace equation can be solved to determine the concentration of a species in all points of the solution (eq.9).
| (9) |
e
_is the initial porosity of the materialThe limit conditions are eq.10, 11, 12.
(10) |
|
| (11) | |
(12) |
 |
The solution is eq.13.
(13) |
 |
D
e : the effective coefficient of diffusionThe amount of diffused particles in the pellet from time t0 to t is eq.14 and the ordinate to origin t1 is eq.15.
(14) |
|
| (15) |  |
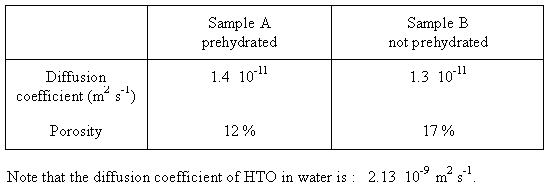
The effective diffusion coefficient can be calculated from the slope of the experimental data when the steady state regime has been reached. The porosity can, thus, be deduced from eq.14. The effective diffusion coefficient and the porosity for the two duplicate samples are summarized in Table II.
Table II. Experimental Measurement of HTO Diffusion Coefficient for Two
Samples.
A Prehydrated and B not Prehydrated
Morphological Results
The first results are general information characterizing the porous medium : volume fraction of all pores, volume fraction of the pores reached by the fluid propagation and a path description (length of shortest paths - which is infinite for water proof samples -, distribution of path lengths...) These results give information about the pore structure. For example, a minimum path equal to the pellet width leads to the conclusion that the sample contains a "straight" path in the medium.
The longer the paths, the more winding they are.
In the x and z directions, propagation is very easy when the minimal tortuosity is very low: 1.06.On the other hand, for the y-direction, the tortuosity distribution is larger ranging from 2.3 to 4.5. This particularly shows the heterogeneous porosity structure in the y direction (compaction axis) due to a non uniform compaction process.
The studied porosity is nearly totally interconnected (See Table III and Fig. 4)
Table III. Calculated volume fraction of porosity
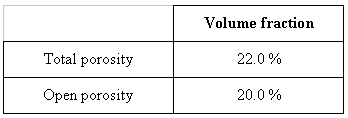
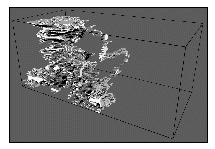
Fig. 4. Porous Medium 3D Reconstruction (With Stretch Along Z Axis)
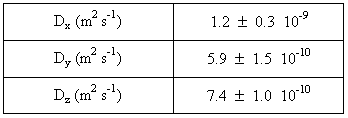
Table IV presents the diffusion coefficients (Dx, Dy, Dz) estimated using the random walk procedure described earlier. The error interval associated to each diffusion coefficient calculation is representative of the quality of the adjustment between the theoretical and experimental curves.
Table IV. Evaluation of the Diffusion Coefficients in the 3 Directions x, y and z by the Residence Time Method (random walk)
Comparison and Discussion
The morphological analysis of the results clearly shows an anisotropy of diffusion in the pellet : the diffusion coefficient is twice as small in the y and z directions perpendicular to the lamellar porosity than in the x direction. We have to notice that for the optimization of the morphological calculation, we need to cut the pellet sides in the X-direction. That's why the diffusion coefficient Dx is probably overestimated. Moreover, the diffusion coefficient in the x and z directions should be the same because of the porosity structure of the pellet which is essentially lamellar perpendicular to the y-direction. This heterogeneity cannot be accessed directly by diffusion measurements.
The measured coefficient diffusion in the y direction is really different from the calculated one (about a factor of 40). The question is how Fick's law, used for the estimation of the measured diffusion coefficient, can be applied to model the diffusion in such a discontinuous medium.
Obviously, this analytical macroscopic method cannot apply strictly to the anisotropic pellet. The numerical approach based on a statistical and morphological study is of great help and provides new information.
CONCLUSIONS
This study helped to shed light on the morphology of a pellet of compacted inactive hulls, and to estimate its main characteristics (porosity and tortuosity). The knowledge of the microstructure is of importance, since physical and chemical reactions, which may occur in future deep storage will of course involve the diffusion of underground water in the pellet.
The various results obtained on a 3D morphological representation of the pellet (minimal path and time, volume fraction, porosity) give useful information about the shape and structure of the propagation paths and on the 3D interconnection of the pores in the medium. This approach has been used to estimate the diffusion coefficient in the three directions.
Those results have been compared to the measured coefficient (in one direction only). They clearly show the anisotropy of the transfer properties in the three directions which cannot be assessed by direct diffusion measurement . This last method is moreover based on the Fick law which should strictly applied to isotropic medium.
In conclusion, those two approaches are complementary and in prospect, we will try to derive benefit from the morphological study to give an adequate interpretation of the diffusion experimental measurement.
BIBLIOGRAPHY