THE IMPLEMENTATION OF GLOBAL POSITIONING
ENVIRONMENTAL RADIOLOGICAL SURVEYOR
(GPERS) FOR LOCATING PLUTONIUM
CONTAMINATION AT JOHNSTON ATOLL
R. W. Doane
Thermo NUtech
B. S. Martinez
Defense Special Weapon Agency
ABSTRACT
A fast, cost effective method for locating various concentrations of plutonium contamination at Johnston Atoll has been implemented. This characterization technology is used to facilitate the excavation process and prevent highly contaminated soil from being mixed with low to moderately contaminated soil. The Thermo NUtech Global Positioning Radiological Surveyor (GPERS) consists of a backpack containing a 486/33 mother board, hard drive, detector cards, GPS receiver, Radio Frequency (RF) modem and display for real-time viewing of survey information. A Base Station is used to provide differential correction to the backpack for submeter accuracy. Data from detectors are tagged with latitude and longitude information each second and are stored on disk.
The current volume reduction technique utilized at Johnston Atoll is the Segmented Gate System (SGS) designed, built, and operated by Thermo NUtech for the Defense Special Weapons Agency. The SGS incorporated thin Sodium Iodide (NaI (Tl)) detectors to identify above criteria contamination and segmented gates are used to divert this material to the waste stream. The below criteria soil is stockpiled for future use. Past excavation procedures were to remove material in predetermined lifts and stockpiled as feed material for processing. By providing area specific "pictures" of contamination levels, excavation could be performed in a manner as not to mix highly contaminated soil with low to moderately contaminated soil. This procedure has minimized the effect of mixing all soil together during the excavation process and has resulted in a higher overall volume reduction of contaminated soil.
INTRODUCTION
Johnston Atoll (JA) is located approximately 800 miles Southwest of Honolulu, Hawaii. The atoll consists of four islands; Johnston Island (JI), Sand Island, North Island, and East Island. Johnston Island originally consisted of 60 acres and was enlarged to its present area of 625 acres by dredging operations. Part of Sand Island and all of North and East Islands were formed by dredging coral sand during channel enlargement operations.
As a result from above ground nuclear weapons testing in 1962, a significant portion of JI was contaminated with 239Plutonium (239Pu). Most of JI and some areas of the surrounding islands were affected, however, an effort was made to contain the largest portion of contamination within a 24 acre area on JI. Several radiological surveys were conducted on JI beginning in 1964 with the most extensive survey performed in 1980 by EG&G (Reference 1) using a germanium detector mounted to a vehicle and suspended at a height of 7.4m above the ground surface. This report shall discuss the radiological survey performed using a hand-held Field Instrument for the Detection of Low Energy Radiation (FIDLER) detector coupled to a data recording device utilizing Global Positioning Satellite (GPS) data.
PURPOSE
A radiological survey was conducted for the Field Command, Defense Special Weapons Agency (FCDSWA) in January 1997 to define and locate the extent of surface transuranic contamination on Johnston Island. The purpose of this survey was to identify and locate contaminated areas for excavation and subsequent mass reduction. The current volume reduction technique utilized at JI is the Segmented Gate System (SGS) designed, built, and operated by Thermo NUtech. Excavated coral sand is stockpiled by specific activity prior to processing. A fast, cost effective method was required to facilitate the excavation process and prevent highly contaminated areas from being mixed with low to moderately contaminated areas. The Global Positioning Environmental Radiological Surveyor (GPERS) was used to define the radiological condition of the site by identifying the 241Americium (241Am) 59.5 KeV photon relative to latitude and longitude and converted to the island grid coordinates (Figure 1).
Figure 1. Global Positioning Environmental Radiological Surveyor (GPERS)
DISCUSSION
A 50-foot grid was established on the plutonium contaminated site to aid the surveyors during the surface scan. A new survey monument, Major Powers, was installed outside the facility fence to establish a reference point for differential correction of satellite information. The GPERS System consists of a backpack containing a 486/33 motherboard, hard drive, two detector cards, GPS receiver, RF modem, interface board, and a heads-up display (HUD) for real-time viewing of survey information. A small portable base station is used consisting of a GPS tripod antenna and a radio modem coupled to a DGPS receiver which is set up over an existing survey monument for establishing latitude and longitude. The base station modem uses a 2 watt transmitter which can provide differential correction information to the GPERS unit within a twenty mile radius depending on terrain. The GPERS software is run from Microsoft Windows for ease of use. Field data can be downloaded in specific formats including ASCII, Excel, TXT, XYZ, and comma delimited DAT files. GPERS output supports Surfer, AutoCAD and other GIS and CAD systems for mapping analysis.
The survey was performed using a FIDLER detector coupled to the backpack unit. A serpentine scanning method was used approximately 2.5-7.5 cm (1-3 inches) above the ground surface at a scan rate of 0.3-1 meter (1-3 feet) per second at 2 meter (6 feet) intervals (Figures 2 and 3). Data was recorded each second which consisted of counts per second at specific latitude/longitude locations. Raw data was downloaded daily to a floppy disk and transferred to the data reduction software for map production. This system yielded from 11,148 to 14,864 square meters (120,000 to 160,000 square feet) of survey data per day. Four (4) fifty-foot square grids were combined during the survey which comprised each data file and individual maps for clarity. The individual maps were merged at the end of the initial survey to generate an overall site map (see Figure 4). All accessible areas were surveyed within a thirteen day period.
Figure 2. Survey Methodology
Figure 3. Survey Methodology
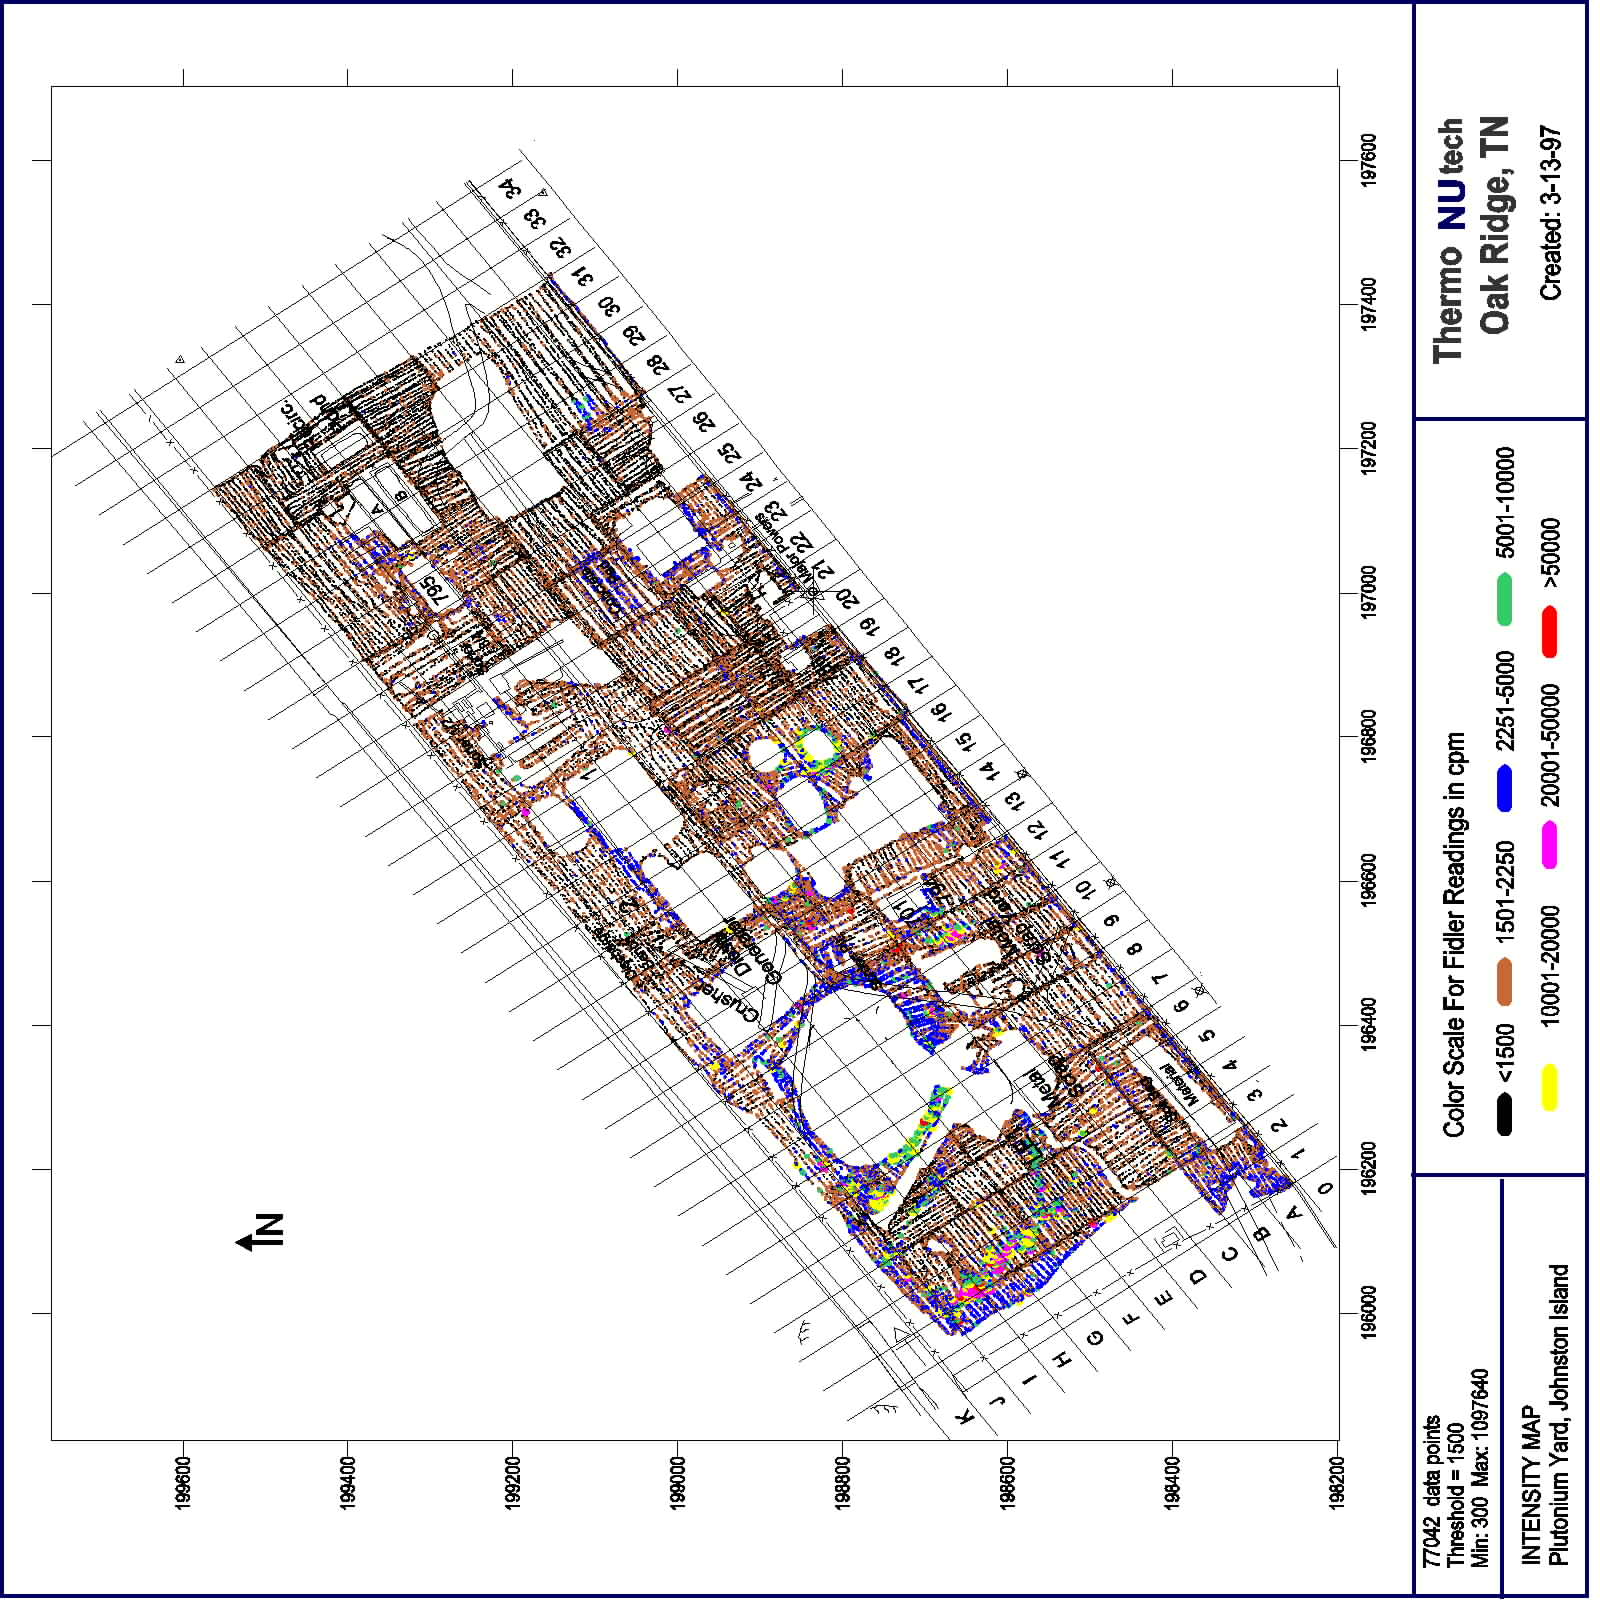
Figure 4. Site Radiological and Position Data Map
Background measurements (Table I) were made at four separate locations on the island to establish a threshold for determining count rate intensities above natural background. These measurements were taken at the Southeast corner, Southwest corner, the "clean pile" in LE-2 on-site, and an area at the east end of JI where non-typical native soil (red soil) was stockpiled. Samples were collected at each measurement location at a depth of 0-5.0 cm (0-2 inches) and are summarized in Table 1. The soil samples were analyzed via gamma-ray spectroscopy using a Low Energy Photon Spectroscopy (LEPS) detector for low photon analysis (i.e. 241Am) and a High Purity Germanium (HPGe) detector for high energy photons to determine the isotopic mixture of each sample. This is necessary to establish a background or "threshold" count per minute level to assess anomalies due to background fluctuations across the island. It appears that Natural Occurring Radioactive Material (NORM) is uniformly distributed across the island with the exception of higher 40Potassium (40K) concentrations found in sample BKG003 which is not native soil. Concentrations of 241Am were below Minimum Detectable Activities (MDA) for off-site samples with the on-site sample showing expected results.
The FIDLER gross count rate indicated over a factor of two higher counts for Location BKG003. Although this detector can not detect the 1.46 KeV photon from 40K, it is believed that the higher NORM content in this sample contributes to the Compton scatter in the lower energy range which elevates the baseline under the 40-600 KeV photons resulting in the increased count rate. However, this cpm value was not used to establish the "threshold" value on-site.
The threshold value was selected to be 1500 cpm which is an average from all background measurements. The industry standard for identifying surface anomalies is a value approximately 1.5 times the background value. This is an appropriate factor for this site due to being able to detect the 60 KeV photon at a depth of 0-2.5 cm (0-1.0 inches). Intervals were selected for count rate intensities at less than the threshold, 1.5 times the threshold, and greater than 1.5 times the threshold to locate surface activity and provide guidelines for excavation.
Table I. Area Background Data
Large areas exist between the threshold value and 2250 cpm which are largely due to variations in background radiation levels. The last interval represents definitive areas for remedial action activities. As the excavation continues, additional areas may be identified subsurface that the walkover survey did not detect. Contour maps can be generated showing contamination surrounding the highest anomalies. Individual grid survey maps are produced to assist the reader in viewing contaminated soil locations.
SUMMARY
The radiological survey conducted with GPERS yielded data to assess the current radiological condition of the site and to provide precise information for excavation of material to be processed efficiently through the SGS system. This particular survey was intended to produce data to identify soil with significant contamination to be stockpiled separately from low to moderate levels of contamination. Upon completion of locating areas of "above criteria" soil, excavation is performed in one-foot lifts. A surface survey is then performed and excavation plans are developed to excise further anomalies. This process continues until no anomalies are detected above the threshold level. At this point, a subsurface characterization will be conducted to evaluate the radiological conditions below grade.
The "clean" stockpile, located in the LE-2 area, was not included in this survey but will be surveyed at a later time. Also a survey is being conducted fifty feet outside the fenced area of the plutonium site and will be presented upon conclusion.
The data presented in this report provides definitive Quality Control of current radiological conditions of the site and can be used as support documentation to the Independent Verification Contractor (IVC) for final disposition of site conditions. Upon completion of locating areas of "above criteria" soil, a detailed survey should be conducted and presented prior to IVC final surveys and assessments. It is also recommended that future consideration be given to using this technology to update the radiological condition of Johnston Island and surrounding islands.
REFERENCES
BACK