ESTIMATING ACTIVE DOE FACILITY
DEACTIVATION AND DECOMMISSIONING COSTS
Robert Myers, Tom Schofield, and Jeff Goodman
Project Performance Corporation
ABSTRACT
DOE’s FY 95 Consolidated Statement of Financial Position reported significant unfunded environmental liabilities, based on the 1995 Baseline Environmental Management Report (BEMR). An Inspector General’s audit of the FY 95 financial statements-performed in preparation for the requirements of the Government Management Reform Act-found that DOE did not include an estimate of environmental remediation costs associated with currently active facilities in its unfunded environmental liabilities and the exclusion of active facilities remediation costs understated DOE’s unfunded environmental liabilities. The IG recommended that the Department develop a methodology, consistent with BEMR, to estimate environmental liabilities from active facilities. This paper discusses the methodology DOE developed in response to the IG audit and presents active facility environmental liability results for FY96 and FY97 using that methodology.
INTRODUCTION
The Government Management Reform Act of 1994 (GMRA) requires selected executive agencies, including the Department of Energy (DOE), to prepare, on an annual basis, audited financial statements reflecting the overall financial position of those agencies, including assets and liabilities. The Act required submittal of the first financial statement by March 1, 1997 for the preceding fiscal year (FY96) and requires for each year afterwards the submittal of a statement by March 1 for the preceding fiscal year. Given the Department’s past history, environmental liabilities represent a significant part of DOE’s financial position. This paper describes an effort to quantify environmental liabilities associated with the Department’s active facilities. These liabilities are generally not otherwise accounted for by the Office of Environmental Management (EM) in their various planning efforts and studies.
DOE’s FY 95 Consolidated Statement of Financial Position reported $206 billion in unfunded environmental liabilities, based on the 1995 Baseline Environmental Management Report (BEMR). An Inspector General’s audit of the FY 95 financial statement (1), which was performed in preparation for GMRA requirements, found that (1) DOE did not include an estimate of environmental remediation costs associated with currently active facilities in its unfunded environmental liabilities and (2) the exclusion of remediation costs associated with active facilities understated the Department’s unfunded environmental liabilities. The Inspector General (IG) recommended that the Department develop a methodology, consistent with BEMR, to estimate environmental liabilities from active facilities.
In light of these findings, the Office of the Chief Financial Officer (CR) initiated an effort last year to quantify environmental liabilities from active DOE facilitiesessentially those owned by programs other than EM so that these liabilities could be reflected in DOE’s financial statement. CR agreed with the IG recommendations from the FY95 audit and proceeded to implement them. The remainder of this paper is organized into two sections. The first section describes the methodology developed in response to the IG recommendations and the results achieved in FY 96. The second section discusses how the methodology changed in FY97 and presents FY 97 results.
FY 96 EXPERIENCE
Unlike the environmental problems associated with the EM program and described in BEMR, potential environmental liabilities associated with non-EM active facilities are relatively unstudied. Given the absence of studies and data, we developed a cost estimating methodology based on existing information about the active facilities and on existing cost estimating tools employed in BEMR.
Methodology
The 1995 BEMR used 15 cost models developed by the Office of Nuclear Material and Facility Stabilization (EM-60) to project stabilization and deactivation costs for categories of contaminated EM-managed facilities. In order to estimate stabilization and deactivation costs for a facility using these models, only the facility category type and size in square footage are required as inputs.
DOE’s real property data base, the Facilities Information Management System (FIMS), contains data on facility types and sizes. Each building or structure in FIMS is assigned one of 282 use codes. FIMS records the size of each building in square feet. Structures are measured by a wide variety of units such as gallons, kilovolt-amperes, and Btu/hr. The cost estimating methodology we developed in FY96 for stabilization and deactivation:
The methodology we developed to estimate decommissioning costs at active DOE facilities in FY96 was highly analogous to the methodology for stabilization and deactivation. In fact, the decommissioning methodology used the same site inputs as the stabilization and deactivation methodology. The 1996 BEMR database contained cost estimates for 285 decommissioning projects at facilities and structures for which there were also stabilization and deactivation costs. This database also contained square footage data for each of the 285 decommissioning projects. Because these projects can be identified as belonging to the set of facilities and structures used to develop EM-60 stabilization and deactivation costs in the 1995 BEMR, the 285 decommissioning projects were sorted into the same EM-60 BEMR model categories used in the stabilization and deactivation FIMS/BEMR cost estimating methodology. Although uncontaminated facilities also undergo decommissioning, these costs are not considered an environmental liability so that facilities classified as the EM-60 -No Liability- model type were not part of the set of 285 projects.
In examining the 285 decommissioning projects, it appeared that facility and waste type were more directly related to decommissioning costs than size. In other words, significant changes in size among decommissioning projects of similar facility and waste type did not produce significant changes in decommissioning cost. Based on this observation, we created a range of decommissioning costs. At the lower end of the range, decommissioning costs were assumed to be fixed with respect to size (i.e., a change in only the size of a decommissioning project would have no effect on the cost). Based on observations of the 285 BEMR projects, this assumption would tend to underestimate decommissioning costs by undervaluing the effect of size. At the upper end of the range, decommissioning costs were assumed to be fully variable with respect to size (i.e., a change in the size of a decommissioning project would have a direct, proportional effect on the cost). Based on observations of the 285 BEMR projects, this assumption would tend to overestimate decommissioning costs by overvaluing the effect of size.
After sorting the 285 decommissioning projects into BEMR model category types, the methodology calculated: (1) the average decommissioning cost for each of the BEMR model categories and (2) the average decommissioning cost per square foot for each of the BEMR model categories. The resulting average cost and average cost per square foot estimates were, in effect, rough decommissioning models respectively for fixed cost models and variable cost models with respect to size. The data received from the sites were then used to estimate a range of decommissioning costs in a manner very similar to that for stabilization and deactivation.
Given the limitations with estimates based solely on a fixed or solely on a variable model, it appeared that the best model for predicting decommissioning costs would be one where costs were forecasted as partially fixed and partially variable with respect to size. We analyzed the 285 BEMR decommissioning projects to determine what percentage of costs were fixed and what percentage were variable with respect to size. To perform the analysis, we first calculated cost using a fixed cost model and then using a variable cost model for each of the 285 projects using the decommissioning cost estimating methodology. To reflect the fact that decommissioning costs were best predicted by a model with both a fixed and a variable component with respect to size, we then set up Equation (1):
CostsDecommissioning = a [Costs from Fixed Model] + b [Costs from Variable Model] (1)
where a represented the fixed proportion of costs and ß represented the variable proportion of costs. We performed a statistical analysis of the data to determine the values of a and ß which would provide the best statistical fit in "predicting" the actual costs. This fit occurred when a » 0.65 and ß » 0.35. In other words, the best model forecasted decommissioning costs as 65% fixed and 35% variable with respect to size. Assuming the fixed vs. variable nature of decommissioning costs will be the same for active contaminated DOE facilities as for the 285 BEMR facilities, we calculated a "best fit" estimated decommissioning cost from the range in the current decommissioning estimate by solving Equation (1) for estimated decommissioning costs as follows in Equation (2):
Est. Decommissioning Cost = 0.65 [Low End of Decommissioning Cost Range] +
0.35 [High End of Decommissioning Cost Range] (2)
The processes of stabilizing, deactivating, and decommissioning active facilities generates wastes. Managing these wastes is part of the Department’s environmental liabilities. The waste management costing methodology involved using 1996 BEMR data to develop a "waste management multiplier," which represented the fraction of waste management costs associated with stabilization, deactivation, and decommissioning as a proportion of the costs of those activities. For 1996 BEMR facilities, waste management associated with stabilization and deactivation represented about 11 percent of stabilization and deactivation costs. Similarly, waste management associated with decommissioning represented about 60 percent of decomissioning costs. With the assumption that these ratios should be similar for facilities included in BEMR and active facilities not included in BEMR, we used the ratios as multipliers on the existing liability estimate to account for waste management costs from stabilizing, deactivating, and decommissioning active facilities.
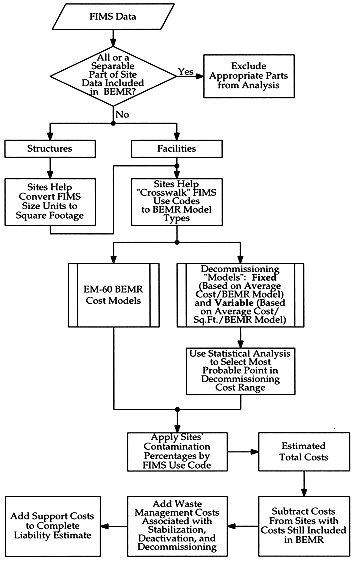
The last step in the methodology was to add support costs. The methodology added a support cost multiplier equal to the average marginal support cost percentage in BEMR. Marginal support costs are those incremental support costs that would be expended in conducting stabilization and deactivation activities. The methodology did not include fixed support costs that sites incur independent of cleanup activities because these will not vary due to the cleanup requirements of currently active facilities. Figure 1 summarizes the methodology for estimating environmental liabilities for the entire process including stabilization and deactivation, decommissioning, associated waste management, and marginal support costs.
Fig. 1. Summary of Methodology to Estimate FY96 DOE Environmental Liabilities from Active Facilities
Results
Our 1996 study found that the Department faced an estimated $12-36 billion in environmental liabilities associated with 2,505 contaminated facilities over and above those outlined in the 1996 BEMR. This liability arises from the eventual need to stabilize, deactivate, and decommission active contaminated DOE facilities at the end of their useful lives, whenever that may be. Figure 2 illustrates stabilization and deactivation, decommissioning, associated waste management, and marginal support costs at the low and high end of the estimated range of environmental liabilities and at the most probable intermediate point in the range.
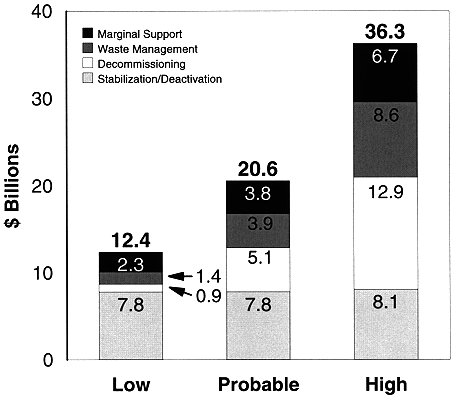
Fig. 2. FY96 results of estimating environmental liabilities from active DOE facilities.
Based on information from a survey we designed and to which DOE Operations Offices responded, it appeared that non-facility-related liabilities such as on-site contamination (i.e., soil and groundwater contamination) and non-routine waste management costs not included in the 1996 BEMR were below the Department’s $1 billion level of materiality for the FY96 Consolidated Statement of Financial Position.
DOE’s IG audited the FY96 financial statement including the 1996 BEMR and the methodology and results for estimating active facilities environmental liabilities. As published in the Department’s financial statement (2), the Inspector General found:
"In our opinion, the consolidated financial statements referred to above present fairly, in all material respects, the financial position of the U.S. Department of Energy as of September 30, 1996, and the results of its operations for the year ended in conformity with the hierarchy of accounting principles described in Note 1."
The IG audit also found that environmental liability estimates were highly uncer- tain. The IG noted that although environmental remediation costs for active facilities were reasonable overall, they were not sufficiently documented at the site level to permit detailed audit verification of input data. The IG recommended that DOE should refine the process for estimating remediation costs for active facilities. CR agreed with the 1996 IG finding and recommendation.
FY97 EXPERIENCE
The approach used to estimate environmental liabilities in FY96 cannot be used in FY97 because the Department is not updating the 1996 Baseline Environmental Management Report (BEMR). Instead, the Office of Environmental Management (EM) is developing a plan-referred to as the 2006 Plan (3)-which will focus environmental cleanup plans over the next decade (and in some cases beyond) and provide an estimate of EM life-cycle costs. This section describes changes made in FY97 to the active facilities cost estimating methodology based on EM's adoption of the 2006 Plan and the 1996 IG audit recommendations.
Methodology
The FY97 methodology contains the same four cost elements used in the 1996 methodology: (1) facility stabilization and deactivation, (2) decommissioning, (3) management of wastes generated during the facility disposition process, and (4) support costs associated with the facility disposition process. The FY97 methodology is essentially unchanged with respect to the first cost element in relying on the EM-60 models. However, we decided to employ DOE’s Automated Remedial Assessment Methodology (ARAM) model to predict decommissioning costs because of the reduced reliance on BEMR for 1997 and ARAM’s greater level of documentation.
Both the EM-60 and ARAM models require only inputs on facility type and size to estimate costs for their respective facility disposition activities. With respect to decommissioning estimates, ARAM allows specification of decommissioning end state as an input. After eliminating one unlikely end state that was generally inconsistent with the 2006 Plan, the others were used to create a range of costs.
The waste management costing methodology uses 2006 Plan data to extrapolate waste management costs from stabilizing, deactivating, and decommissioning EM facilities to conducting similar activities on active facilities. More specifically, the approach calculates the ratio of waste management costs for stabilizing, deactivating, and decommissioning EM facilities to the respective costs of stabilizing, deactivating, and decommissioning those EM facilities. With the assumption that these ratios should be similar for active facilities, we use the ratios as multipliers on our existing liability estimates to account for waste management costs from stabilizing, deactivating, and decommissioning active facilities. The 2006 Plan did not have sufficient detail to separate waste management costs for stabilization/deactivation vs. decommissioning. As a result, there is a single, consolidated waste management multiplier in FY97.
Our method for including support costs is to develop a support cost multiplier in a manner similar to last year’s approach. The multiplier uses DOE’s most recent support cost data to determine marginal support costs and assumes that active facility support costs are fairly represented by existing Department marginal support costs. The multiplier also adjusts for the amount of support costs already included in the models. While ARAM includes virtually no support costs, the EM-60 models include a significant amount of support costs. In fact the amount of support costs included in the EM-60 models exceeds the marginal support cost rate. As a result, the support cost multiplier for stabilization and deactivation is less than one which implies a negative support cost adjustment for stabilization and deactivation activities in FY97. Figure 3 summarizes the active facility cost estimating methodology for FY97. \
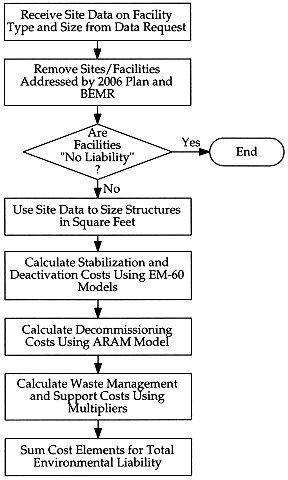
Fig. 3. Summary of FY97 Active Facilities Cost Estimating Methodology.
Results
The 1997 study found that DOE faces a range of about $16.8-17.4 billion in environmental liabilities for 3,178 active contaminated facilities not currently managed by EM and not considered "pipeline" facilities which were scheduled to be transferred to EM between 1996 and 2000 as described in the 1996 BEMR. As with FY96, this liability arises from the eventual need to stabilize, deactivate, and decommission active contaminated DOE facilities which have reached the end of their useful lives, whenever that may be.
Figure 4 illustrates stabilization and deactivation, decommissioning, associated waste management, and marginal support costs at the low and high end of the estimated range of environmental liabilities. Note that support costs at both ends of the range are negative because the support cost multiplier is less than one for stabilization and deactivation costs. Although the support cost adjustment for decommissioning is positive, the net effect is negative because stabilization/deactivation costs are so much larger than decommissioning costs.

Fig. 4. Summary of FY 1997 Active Facilities Environmental Liability Results.
REFERENCES
1. Audit of the U.S. Department of Energy’s Consolidated Statement of Financial Position (As of September 30, 1995), U.S. Department of Energy, Office of Inspector General, Office of Audit Services, Report No. IG-FS-96-01, Germantown, MD (February 29, 1996)
2. Consolidated Financial Statements for Fiscal Year 1996, U.S. Department of Energy, Office of the Chief Financial Officer, Washington, DC (March, 1997)
3. Accelerating Cleanup: Focus on 2006, Discussion Draft, Department of Energy, Office of Environmental Management (June, 1997)