LESSONS LEARNED FROM SOIL REMOVAL
ACTION CASE HISTORIES
Jacques P. Lord
Bechtel Environmental, Inc.
ABSTRACT
In the fall of 1996, soil removal actions were performed at three Installation Restoration Program (IRP) sites under an approved Action Memorandum signed by the Base Realignment and Closure (BRAC) Cleanup Team at a closed Department of Defense facility in southern California. At all three IRP sites, soil was excavated in accordance with the Action Memorandum and confirmation soil samples were collected over a statistically-derived grid pattern to assess if target cleanup goals (TCGs) had been met. Per the work plans, cleanup goals were achieved if the mean of the reported values was below the TCG for each contaminant. The sampling grid size and the use of the mean to achieve closure was developed in accordance with U.S. EPA guidance on attaining soil cleanup goals. In addition, no reported analytical value would be allowed to exceed twice the TCG as a way to prevent low practical quantitation limit values from potentially permitting a significant hotspot to go unmitigated. Contaminants of concern included polychlorinated biphenyls, polynuclear aromatics, lead, beryllium, and chromium.
Industrial-scenario risk-based TCGs were achieved after one excavation event for the first site. Confirmation sample results reported two values over TCGs, but the mean was well below that. The site was backfilled with clean soil. The excavated soil was nonhazardous and transported to stockpiles on site to be used as a foundation layer for a landfill closure cap (to be constructed in 1998 at a separate IRP site on the same facility).
Several confirmation sample results from the other two sites reported contaminants of concern well above twice the residential-scenario TCGs. Several rounds of excavation and confirmation sampling were performed at both sites in accordance with decision rules approved in the work plans. These decision rules specified additional volumes of soil to be removed with follow-up confirmation sampling. An important lesson learned was recognizing how the local geology (organic-rich peat layers on top of alluvial sands) controlled the distribution of contamination. This was critical to reducing the iterations of soil removal/confirmation sampling as stated in the work plans and achieving successful removal of the contaminated soils. As with the first IRP site, the excavated nonhazardous soil from the two other sites was transported to stockpiles on base to be used as a foundation layer for the landfill closure cap mentioned previously.
Once the confirmation samples for each site reported a site-specific mean below the residential TCGs, the two sites were backfilled. A closure letter was obtained from regulators for all three sites in March of 1997. Significant savings were achieved in cost and schedule by using the mean TCG value instead of achieving compliance at each sample point, and recognizing shallow geological controls to contaminant distribution.
INTRODUCTION
In the fall of 1996, the United States Department of Defense performed remediation activities associated with three sites at a closed military facility in Southern California. The remediated locations are identified as sites A, B, and C (See Figures I, II, and III) and were all soil removal actions performed in accordance with an approved Final Action Memorandum(1) signed by the Base Realignment and Closure Team.
The contaminants of concern included polychlorinated biphenyls (PCBs) at site A, PCBs and polynuclear aromatic hydrocarbons (PAHs) at site B, and PAHS, lead, chromium, and arsenic at site C.
The soil removal actions included the excavation and disposal of contaminated soil
either to an offsite disposal facility (if hazardous) or to the existing solid waste
landfill on the facility property to be used a foundation layer for a final landfill cap.
Verification soil sampling was conducted on the excavation sidewalls and floors to
document that target cleanup goaltarget cleanup goals (TCGs) identified
in the Final Action Memorandum were achieved. Site restoration (backfill) was performed at
these three sites. The maximum concentrations of contaminants and the TCGs for the three
sites is given in Table I.
Table I. Maximum Contamination in Soil and Target Cleanup
Goals for the Three Sites
In the course of performing the scope of work described above, several situations came up that lent themselves to lessons learned for similar site closures. These lessons learned had a significant impact on the successful completion of the three soil removal actions and can be summarized as follows:
The following sections will detail some of the experiences learned in the course of performing the soil removal actions and suggest the conditions under which these experiences can be used elsewhere.
Figure 1. Site A layout
Figure 2a. Initial excavation layout at Site B
Figure 2b. Final excavation layout at Site B

Figure 3a. Initial layout of Site C
Figure 3b. Final layout of Site C
USING THE MEAN TO ATTAIN CLEAN UP
Establishing How to Calculate the Mean
For site closure the work plans stated that the statistical mean of the confirmation sampling results must be at or below the TCG value and an individual value can not be above twice the TCG. Duplicates were not a part of the statistical population. Reported detection limit values were used in the mean calculation, rather than half the detection limit as a conservative measure.
The sample size needed to estimate the mean concentration of a given contaminant at a given site was determined using formula 6.6 in the Methods for Evaluating the Attainment of Cleanup Standards Volume I: Soils and Solid Media, U.S. EPA 230/02-89-042, February 1989. This formula is as follows:
| Eq. 1 |
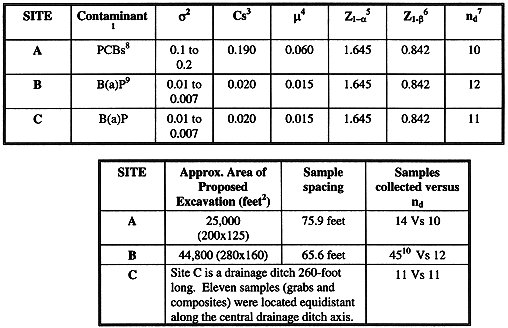
Where nd is the sample size, s is the estimate of standard deviation expected in the analytical results, a is 0.05 for a false negative rate of 5%, b is 0.20 for a false positive rate of 20%, Cs is the cleanup standard, and m is the mean concentration where the site should be declared clean with a high probability. The m and s values were derived from concentrations reported in published reports on the three sites. The values used and the results obtained are summarized in Table II. The dimensions of the site are not considered in this approach to calculating a sample size. Calculated values for the sample size were dependent on the existing data for contaminant concentrations and ranged from calculated values of 10 to 12 samples per site.
Table II. Calculation Summary for the Determination of Sample Size and Spacing
Notes:
After deriving a number of samples that was statistically valid to derive the mean, formula 5.3 in the above-referenced U.S. EPA guidance was used to determine the sample spacing.
Triangular grid spacing = [area of site¸ (0.866 x sample population)]0.5
A triangular grid spacing of approximately 65 feet was calculated for the estimated size of site B at approximately 280 by 160 feet and using 12 as the sample size, nd. As stated in the work plans, a 60-foot spacing was used to make field layout easy and to use a smaller spacing size. This sample spacing was used at all three soil removal sites.
Once the number of samples and the grid on which the samples are located is established and approved, there is a statistical basis for saying "no" to the eternal request to provide more samples. Yet this statistical approach to achieving cleanup goals is not as common, at least to the authors knowledge and experience, as one would imagine. Apparently the more common approach is to have every confirmation sample report below site-specific TCGs, according to discussions with the regional agency representatives. This approach is more advantageous to getting approved plans quickly, but the potential savings and shorter schedule to achieving cleanup is not realized.
Cost Advantages to Using the Mean to Achieve TCGs
There was no cost advantage to using the mean for Site A since all of the confirmation samples reported below the industrial-scenario TCG for PCBs at that site. The TCGs for Sites B and C, however, were very low residential-based TCGs, especially for benzo(a)pyrene (See Table I), and three or four iterations of excavation and confirmation sampling took place before even the mean was below the TCG. One can only speculate how much additional soil would have been removed if all confirmation samples had to be below the mean, but a total of 13 and 4 confirmation samples were above the TCGs and left unexcavated at Sites B and C, respectively. The cost of the additional removal for those 17 points is estimated to be on the order of $6,000 per confirmation point, including the additional soil removal and trucking, labor, confirmation sampling, laboratory work, schedule delays, and backfill. Therefore the savings realized from using the mean to leave some slightly elevated soils behind is estimated to be $102,000.
SHALLOW STRATIGRAPHIC CONTROL OF
CONTAMINATION DISTRIBUTION
In the course of excavating Site B, the first two iterations of confirmation sampling resulted in the recognition of a pattern relating the shallow stratigraphy with the reported results. Two units were being observed, the first consisted of dark colored fill material on top of dark-colored peat-rich loamy sands and silts; the second was a light tan to pale yellow, well sorted sand with almost no organics in it. The confirmation samples collected in the dark fill and organic material always reported contaminants and a third of the samples were over twice the TCGs. The confirmation samples collected from the sand layer were either reporting no contaminants to within reportable quantitation limits or close to the TCGs. Once this pattern was recognized, the decision was made to remove all of the fill and organic material above the sand. Figure IV illustrates this decision using a cross-sectional view of Site B. The same stratigraphy was recognized at Site C and similar removal strategies were employed to achieve cleanup goals faster.
Figure 4. Cross-Sectional Representation of Stratigraphic Influences on the Soil
Removal Action
Cost Advantages to Recognizing the Shallow Geological
Controls to Contaminant Distribution
The removal of a significant quantity of soil that was not anticipated was an additional cost to the program. But recognizing that the entire fill and dark organic layer had to be removed rather than approaching it by the step-by-step procedures as stipulated in the work plans saved the program at least two weeks of time. With the confirmation analyses on the order of $700.00 per sample, not including sampling labor, data management, validation, and reporting, and a 2-day turnaround time, the cost-savings to removing the material in one effort and reducing the amount of analyses required is on the order of approximately 25 samples or $17,500 in analytical costs alone.
DISPOSAL OF EXCAVATED SOILS ONSITE
It was always a plan by the Base Closure Authority to recycle the contaminated soils (not designated hazardous) on the base by employing the soil as a foundation layer for a landfill closure cap. This included soils contaminated with metals that required stabilization treatment prior to use in the foundation layer. The lesson learned in using contaminated soils onsite at this particular base was the need to revisit volume assumptions for the foundation layer in the landfill closure design. Since the landfill design was ongoing at the same time as the soil removal actions, the amount of excavated material to be removed was estimated in the closure plans for Sites A, B, and C and these estimates were used in the landfill closure design. In the case of Site A, the estimate was very accurate. With the additional materials removed at Sites B and C, as well as additional soils removed from numerous other sites on the same base, the actual volume of contaminated and stabilized soil available for use as a foundation layer was considerably larger than the estimates used in the design. Revisiting the stockpiled foundation soil prior to final 100% approval of the landfill closure plans in order to provide a quantitative measure of actual foundation layer material available will be crucial to the construction phase of the landfill closure. It is expected that relying on the excavated volumes reported in closure reports would be a mistake, rather than measuring the stockpiles' volumes. This work is scheduled for mid-1998.
WHY SOIL SCREENING WASN'T USED TO ASSESS
EXCAVATION PROGRESS
The use of rapid, portable, analytical screening tools to assess the progress of excavation is normally a very helpful key to efficient field operations during soil removal actions. Initially the soil removal actions for Sites A, B, and C were planned with the inclusion of immunoassay field analyses for PCBs and PAHs [X-ray fluorescence was considered as a screening tool for the metals at Site C, but the detection limits for X-ray fluorescence were immediately seen as inadequate given the low TCGs (Table I)]. The site-specific TCGs for PCBs and PAHs are very low for Sites A, B, and C but immunoassay detection limits can be customized to these microgram per kilogram levels if the matrix effects in the site soils are insignificant. The immunoassay vendor accepted ten soil samples collected from clean areas of the base and determined the site-specific matrix effects and detection limits for their PCB and PAH immunoassay kits. Unfortunately the matrix effect was significant enough, and the TCGs low enough that the potential use of immunoassay kits was eliminated. Therefore the excavation work progressed by use of offsite confirmation analyses and a 2-day turnaround time. A mobile onsite lab was not used due to cost and certification issues when the estimated number of samples was considered.
As it turned out, once the shallow stratigraphic pattern was recognized, backfilling and demobilizing at risk (prior to receiving analytical results) was deemed an acceptable risk, and this turned out to be an appropriate action.
SUMMARY
The United States Department of Defense performed remediation activities associated with three sites at a closed military facility in Southern California. The remediated locations were all soil removal actions performed in accordance with an approved Final Action Memorandum signed by the Base Realignment and Closure Team. The contaminants of concern included polychlorinated biphenyls, polynuclear aromatic hydrocarbons, lead, chromium, and arsenic. The soil removal actions included the excavation and disposal of contaminated soil either to an offsite disposal facility (if hazardous) or to the existing solid waste landfill on the facility property to be used as a foundation layer for a final landfill cap. Verification soil sampling was conducted to document that TCGs were achieved. Site restoration (backfill) was performed.
CONCLUSIONS
In the course of performing the scope of work described above, several situations came up that lent themselves to lessons learned for similar site closures. These lessons learned had a significant impact on the successful completion and reduced costs of the soil removal actions and can be summarized as follows:
The author wishes to acknowledge the support and guidance of the Base Closure Authority Coordinator, Mr. Tom Bartol, the Base Field Engineer, Mr. Gary Jungwirth, and the Base technical reviewer, Mr. Bill Muir.