![]()
(1)
MAGNETOMETER SENSOR FOR GAUGING DEPTH OF
HIGH-LEVEL RADIOACTIVE WASTE IN UNDERGROUND
STORAGE TANKS
F.R. Reich and G.A. Barnes
SGN Eurisys Services Corporation
Post Office Box 840
1200 Jadwin, Suite 500
Richland, WA 99352
ABSTRACT
A depth sensor was developed to provide data for determining the volume of waste remaining in large underground storage tanks. These tanks contain high-level radioactive waste, a by-product from the weapons material processing at the Hanford Site. The volume of waste remaining in a tank is one of the parameters for assessing retrieval and closure alternatives for the Hanford tanks. This depth sensor is a magnetometer-based proximity sensor that senses magnetic field changes with a Giant Magnetoresistive Bridge (GMR) sensor. Waste depth is gauged by setting the sensor on the surface of the tank waste and measuring the relative location of the carbon steel bottom of the tank as indicated by changes in the magnetic field. The sensor design uses an unshielded electrical coil and permanent magnet to provide the magnetic field. Testing has demonstrated that the sensor is temperature sensitive but radiation tolerant and not sensitive to iron content of the radioactive waste. Calibration and deployment methods were developed to extract accurate, calibrated depth data from the sensor, compensating for the sensor interferents. Blind tests with simulated tank deployments were used to verify and validate the dimensional measurement performance. Depth measurement data from the deployment of the sensor in a radioactive waste tank and from tests with simulated tank segments are discussed. This work was supported by DOE's EM-30 and EM-50 Hanford Tank Initiative Project.
INTRODUCTION
This paper describes a magnetometer-based sensor that was used to measure the residual caustic, radioactive waste in the bottom of underground tanks. The development and deployment of probes for assessing waste volume is part of the work scope for the Hanford Tank Initiative (HTI) (Banning, 1997), which is a teaming effort supported by the U.S. Department of Energy Office of Waste Management (EM-30) and the Office of Science and Technology Development (EM-50).
MAGNETOMETER PROBE DESIGN AND OPERATIONAL PRINCIPLES
The magnetometer sensor consists of a magnetic field generator (electric coil and permanent ring magnet), a magnetic flux sensor, (Giant Magnetoresistive Ratio (GMR) bridge), and a stand-alone, electronic readout module as shown in Figure 1. The magnetic flux from the coil and ring (permanent) magnet are sensed by the GMR sensor which is arranged in a bridge configuration with two of the elements equipped with magnetic shields. The GMR generates a voltage that is proportional to the magnetic flux strength. Since there may be hydrogen in the waste tanks, the magnetometer sensor was designed with amplitude limited voltages and currents that are below limits needed to ignite a combustible mixture of hydrogen and air. A thickness reading is made by placing the sensor on the surface of the waste and then sensing the distance to the steel in the bottom of the tank as indicated in Figure 1. The tank is made of carbon steel, that has very high magnetic permeability (measure of the ability of a material to carry magnetic flux). Since the tank floor is essentially an infinitely large surface, relative to the size of the magnetometer dimensions, the magnetometer output will be proportional to the distance to the tank bottom, which is the desired waste thickness parameter. The thickness response of the magnetometer sensor is:
|
|
(1) |
where F(x) is the probe output (volts), x is thickness, and a, b, and c are constants. This shows that the probe response varies in a non-linear, exponential manner with thickness. Curves of this nature are characterized by asymptotic limits. The result is a maximum discernable thickness value that the probe can reliably detect and an accuracy that decreases with increasing thickness.
MAGNETOMETER TESTING
Before the magnetometer probe was deployed in a high-level waste tank, a number of tests were performed to evaluate potential interferences in the measurement of waste thickness. The magnetometer probe was also tested with the tank mockup and deployment hardware (discussed in a later section), shown in Figure 2, that contained representative tank floor and wall components and a simulated knuckle that is a curved interface between the tank floor and wall areas. The testing indicated that the magnetometer sensor was not sensitive to:
However, the tests did show that the probe was sensitive to:
The results of this cold testing indicated that a simple, single point readout would not produce a reliable thickness value.
The performance of the magnetometer was tested in a 500 rad/hour environment in a Gamma Irradiation Facility. This facility has an array of sealed cobalt-90 capsules that are at the bottom of a large, water-filled caisson. A steel plate with a fixed thickness space was attached to the bottom of the probe and the probe lowered in one of the access tubes in the caisson. In the 500 rad/hour gamma field, a change of less than 6 percent was recorded while the post-exposure change was less than 1 percent. The impact of these variations is small compared with the accuracy variations of the magnetometer probe, which are discussed below.
The potential impact of tank waste material and iron oxide was tested by evaluating the probes response with 1.0-inch layers of tank waste simulant and a 1.0-inch layer reagent grade iron oxide powder under the probe. With each of these materials, the response from the probe varied less than 5 percent from a 1.0 inch "air gap" reading indicating there was no sensitivity to these materials.
Video data from some of the waste tanks indicated that the waste surface is not flat or smooth. The tank mockup was used to show that if the probe is skewed in a five degree range, there would be a change in the dc level (bias) of the magnetometer response, but that the relative response to a thickness variation remained unchanged. This indicates that a curve fit method of data extraction, described below, will provide compensation for probe skew that are in the five degree or less range. However, to assure the reliability of waste thickness data, an effort should be made to deploy the probe as close to perpendicular to the tank floor as possible.
Archive historical tank data indicate that the AX-104 tank waste contains a significant inventory of heat-producing fission products, specifically cesium and strontium species (Brevick, 1994). The probe and a tank mockup were placed in an environmental chamber and the temperature varied over a 25.2 oC (77.4 oF) to 65.4 oC (149.7 oF) range. The results in Figure 3-a show that the output of the magnetometer is strongly affected by temperature with the changes being somewhat erratic and non-reproducible.
The active probe components (Figure 1) are potted in a non-ferromagnetic, hydrocarbon material. Testing showed that when the probe is within 18 inches of a tank wall, there will be an impact on the probe readout. The sensitivity is reduced (the iron mass of a wall flattens out the response curve and decreases its amplitude span.) Calibration curves, as a function of distance to the wall, need to be used in extracting a thickness value from the magnetometer response and the distance to a wall measured or estimated during in-tank deployments.
MAGNETOMETER DATA EXTRACTION AND DEPLOYMENT
An examination of the magnetometer test data indicated that temperature and steel mass interferences shifted the dc bias of data but didn't change the relative thickness response. This is illustrated in Figure 3-b where the dc off-sets of the curves in Figure 3-a have been removed. All of the data points now overlap. This shows that these interferences can be compensated using a curve fit procedure where a "thickness response curve" for a point above a waste layer are matched to a calibration. The point where the data with the probe resting on the waste surface ends up as the thickness value. The relative shape of a magnetometer response (the relative response of the magnetometer was not affected by the interferents) is now used rather than a single response point.
Magnetometer Probe Deployment Hardware
To generate data curves with the magnetometer probe, the deployment hardware shown in Figure 2 was used. Access to the waste in the underground storage tanks is through "risers" which are stand-pipes that extend about 2-ft above grade. The magnetometer probe and signal cable is extended through these risers to make contact with the waste surface. The probe and cable are covered with a thin plastic (non-conductive) sleeve that shields them from being contaminated by the caustic, radioactive tank waste. This sleeving is disposed of as low-level waste when the probe is removed.
The vertical position of the magnetometer probe is controlled with a special fixture that has six slots (spaced at 1 inch increments) in it where a handle, attached to the signal cable, is placed. Before a measurement sequence is started, the probe is placed on the waste surface, the cable slack is removed, and the handle attached to the cable. At each vertical position of the handle (or notch), a magnetometer reading is recorded. The ensemble of data points forms the "above the waste" data curve that is used to extract the waste thickness value. The magnetometer sleeve, shown in Figure 2, holds the probes horizontal position stationary while the magnetometer probe, which is inside the sleeve, is raised and lowered during the data acquisition process. This feature is necessary as tethered probes can experience uncontrolled swinging during deployment in a tank riser and the waste surface can have significant thickness variations over small lateral distances (3-6 inches).
Calibration Data
Since the magnetometer was sensitive to the tank wall, calibration data was obtained using two tank mockups, one included a tank wall and knuckle (Knuckle Mockup) the other consisted of a flat plate (No Knuckle Mockup). The No Knuckle Mockup calibration data was used for deployments greater than 18 inches from a tank wall, while the Knuckle Mockup calibration data was used when the wall was within 18 inches of a tank wall. The steps used to generate and process the magnetometer calibration data are as follows:
1-a. For risers near the tank wall (Knuckle model), obtain calibration curves at two-inch offsets, over a 9 to 18-inch range.
1-b. For risers in the center of the tank (No Knuckle model), only a single calibration curve is needed.
Thickness Extraction From Magnetometer Data
The process of extracting a thickness value from magnetometer data is a curve fit process. The data acquisition starts with the magnetometer sensor resting on the waste surface. The magnetometer response is then recorded at one-inch intervals above the waste using the hardware shown in Figure 2. A curve from these data is then overlaid with the calibration and shifted horizontally until a shape match is obtained to the calibration data. The amount of the shift to achieve the curve match is the thickness of the waste under the magnetometer sensor. Details of the data extraction process are as follows:
The overlap status can be monitored during curve shifting by generating the sum of the point-to-point differences between the calibration and unknown curves. The best curve overlap is obtained when there is a sign change for this summed value (positive to negative or negative to positive).
Figure 4 shows an example of this data processing. The curves, 0.8 inch, 0.9 inch, and 1.0 inch, show the Unknown C curve shifted 0.8, 0.9, and 1.0 inches, respectively along the X-Axis. The sum of the curve differences (sum of {No Knuckle Model (x) - Unknown C(x)} ) changed signs between the 0.8 inch and 0.9 inch shifted curves. However, since the 0.9" shift provides the best overlap with the calibration data, 0.9 inches is the best estimate of the thickness value. The actual thickness for Unknown C was 1.13 inches (an error of 0.23 inches). If the best overlap is between two shift conditions, then the thickness value lies somewhere between the two thickness values.
MAGNETOMETER PERFORMANCE ASSESSMENT
A series of blind tests were completed to evaluate the performance of the magnetometer probe and data extraction method. In these tests, the tank mockup and deployment hardware, shown in Figure 2, were used with polyethylene spacers to simulate different waste thicknesses. The thicknesses were not known until after the magnetometer data was processed and a thickness value extracted. A comparison of actual thickness value with the measured value was then made. The results of the performance evaluation tests are shown in Table 1. The maximum thickness value used in the blind tests was 3.5 inches. Where the best thickness value from the curve fit process above was between two thickness values, both values are listed. The table also shows the difference (error) between the magnetometer thickness value and the actual thickness value. The last column in the table shows the envelope of this difference, which is the measurement error (the absolute value of the largest error shown in the previous column).
Figure 5 shows a plot of the error envelop verses thickness for the actual error data. The curve that was fit to these points is the estimated error performance of the magnetometer probe. Since these performance tests did not include thickness values greater than 3.5 inches, the errors in the 3.5 inch to 5-inch thickness range must be treated as estimates. These curves show that the measurement error of the magnetometer probe increases with increasing thickness, which was anticipated due to the exponential shape of the magnetometer thickness response. For a 0 to 2.0-inch range, an error of less than 0.25 inches was obtained. For a 2.0 inch to 4.0-inch range, the error is in the 0.5-inch range. For ranges above 4.0 inches, the error approaches 1.0 inches. Although this appears to be a very large error, a 1.0-inch error at a 5.0-inch range represents an error of 20 percent . The Estimated Error Curve, in Figure 5, is a curve fit for the error data that has a root mean square error estimate of 0.23 inches from the actual data shown.
Table I. Magnetometer Performance in Blind Thickness Tests
SUMMARY AND CONCLUSIONS
A magnetometer probe has been developed for in-tank measurement of the thickness of salt- cake waste in Hanford's underground storage tanks. The probe measures waste thickness by sensing the distance to the ferromagnetic steel bottom of the tank. The cold tests with simulated tank environments and waste materials demonstrated that the probe was not sensitive to:
However, the tests did show that the probe was sensitive to:
A method of calibration and data extraction, based on curve fitting, was developed and tested that extracts a thickness value independent of temperature and small probe misalignments. The testing also indicated that the limit of influence for the wall features was an off-set greater than 18 inches. Under 18 inches, calibration data using tank models with wall features will be required.
Blind tests with "unknown" thickness parameters were used to evaluate the probe and data extraction method. The probes thickness accuracy ranged from about 0.2 inches (0 - 1.0 inch range) to an accuracy of one inch at the 5-inch range limit. This thickness range appears to be adequate for a tank that has been sluiced and now has a small inventory of saltcake waste residue.
Special deployment hardware was developed and tested that provided the probe data for the curve fit, data extraction process. This hardware was designed for deployment in AX-104's six inch and 14-inch risers. Video cameras deployed in other tank risers would be used to assess the alignment and status of the deployed probe. The magnetometer has been successfully deployed in one tank with radioactive, caustic wastes (Reich, 1997).
REFERENCES
Banning, D.L, 1997, Tank 241-AX-1045 Waste Characterization Data Quality Objective, HNF-SD-WM-DQO-027, prepared by Lockheed Martin Hanford Corporation, Richland, Washington for the U.S. Department of Energy, Richland, Washington.
Brevick, C.H., L.A. Gaddis and W.W. Pickett, 1994, Historical Tank Content Estimate of the North East Quadrant of the Hanford 200 East Areas, WHC-SD-WM-ER-349, Rev. 0, prepared by ICF Kaiser Hanford Company, Richland, Washington, for the U.S. Department of Energy, Richland, Washington.
Reich, F.R., 1997, 1-AX-104 Residual Waste Volume Estimate, HNF-SD-HTI-ER-001, Rev. 0, prepared by SGN Eurisys Services Corporation, Richland, Washington, for the U.S. Department of Department of Energy, Richland, Washington.
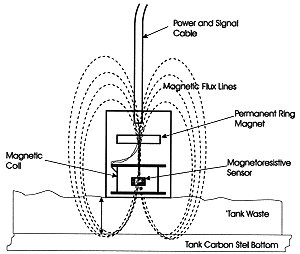
Fig. 1. Components of Magnetometer Probe in Waste Depth Sensor
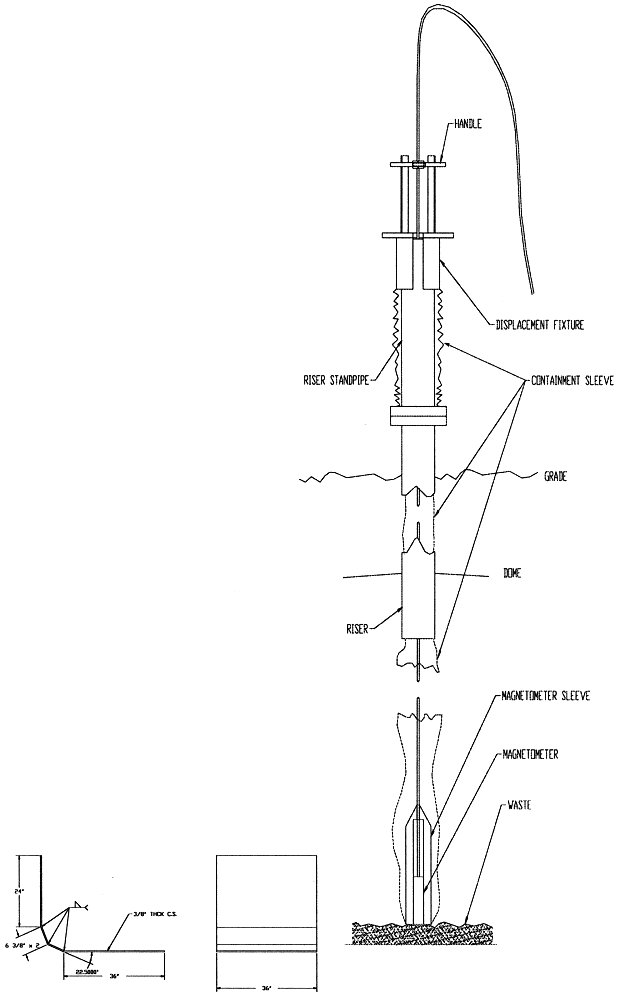
Fig. 2. Magnetometer Deployment in Underground Waste Tank and Tank Mockup Model
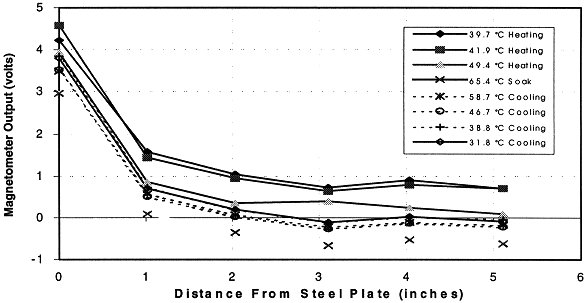
Fig. 3a. Temperature Sensitivity of the Magnetometer Probe
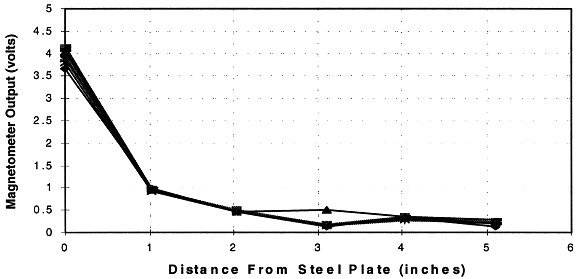
Fig. 3b. Magnetometer Temperature Data Shifted to a common Base-line.
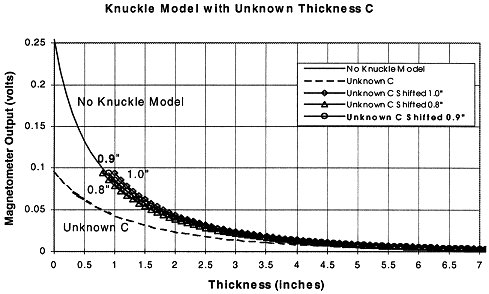
Fig. 4. Extraction of a Thickness Value from Magnetometer Calibration Data. The 0.9 Inch Shifted Curve of the Unknown C Test Shows the Best Curve Overlap with the No Knuckle Calibration Curve. The Estimated Thickness is 0.9 Inches which Compares Favorable with the Actual 1.13 Inch Thickness Value.
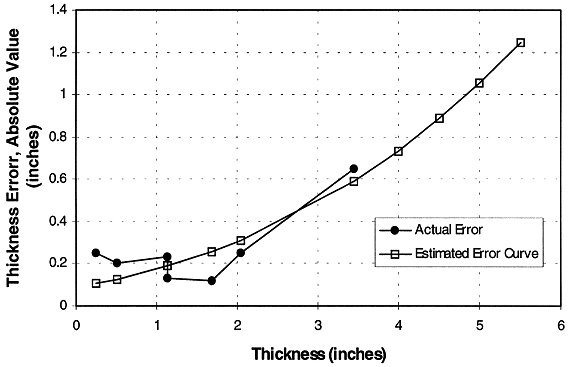
Fig. 5. Magnetometer Probe Accuracy Derived from Blind Testing. The Estimated Error Curve is a Curve Fit to the Error Data (RMSEE = 0.23 inches)