
INTEGRATION OF A GEOTECHNICAL MONITORING PROGRAM WITH A GEOGRAPHICAL INFORMATION SYSTEM
C.T. Francke, S.J. Patchet, and R.C. Carrasco
Westinghouse Waste Isolation Division
Box 2078
Carlsbad, New Mexico 88221
ABSTRACT
A geotechnical monitoring program has been underway for over fifteen years at the Waste Isolation Pilot Plant (WIPP). This system consists primarily of geomechanical and hydrological instrumentation as well as geological field data such as core logs, maps and photographs. The Geotechnical Monitoring Program (GMP) has collected tens of thousands of data points and records. The quantity of data collected, while required to satisfy regulatory and stakeholder concerns, is nevertheless quite cumbersome. Data retrieval and analysis is made difficult by the sheer volume. Recently, a Geographical Information System (GIS) was integrated with the WIPP GMP to improve the usability of the system.
INTRODUCTION
Waste Isolation Pilot Plant
The Waste Isolation Pilot Plant (WIPP) is located in southeastern New Mexico, 42 kilometers east of Carlsbad. WIPP is a U.S. Department of Energy facility designed for permanent disposal of transuranic radioactive wastes left from the research and production of nuclear weapons. Project facilities include disposal rooms excavated approximately 655 meters underground in an ancient, stable salt formation. Transuranic waste consists of clothing, tools, rags, and other such items contaminated with trace amounts of radioactive elements, mostly plutonium.
Geotechnical Engineering
The WIPP Geotechnical Engineering Program is designed to provide the geologic information necessary to establish a high level of understanding of site characteristics and to provide timely assessments of the stability and performance of underground openings. The Geotechnical Engineering Program currently consists of the following three activities:
The Geotechnical Monitoring Program uses instruments installed in the shafts and drifts to assess the performance of the WIPP facility. The instrumentation system provides data for design validation, for routine evaluation of the safety and stability of excavations, and for determining the short-term and long-term behavior of underground openings. Data on the stability and closure of underground excavations are utilized to identify areas of potential instability and to ensure that remedial action, if necessary, is taken in a timely manner.
The Geosciences Program includes geologic and fracture mapping, maintenance of a geologic (core) sample storage facility, seismic monitoring and evaluation, and other special activities that are performed on as-needed basis. The purpose of the Geosciences Program is to provide input to help confirm the suitability of the site to contain and isolate TRU radioactive waste.
The Ground Control Program provides for the design and monitoring of the ground control systems required to maintain underground safety. The Ground Control Program uses input from the other programs to determine the need for rock bolts and other ground support fixtures throughout the underground facility.
GEOTECHNICAL MONITORING PROGRAM
The purpose of the geomechanical monitoring program is to provide in-situ data to support:
The geomechanical instrumentation system (GIS) used in the WIPP facility provides data which are collected, processed, and stored for analysis. The following discussion briefly describes the major components of the GIS.
Instrumentation
Instruments installed for measuring the geomechanical response of the shafts and other underground openings include convergence points, convergence meters, extensometers, rockbolt load cells, pressure cells, strain gauges, piezometers, and joint meters. A summary of the geomechanical instrumentation is presented in Table I.
Table I. Instrument Summary
Data Acquisition
The individual geomechanical instruments are either read manually, using portable devices, or remotely, by activating polling devices from the surface. Remotely read instruments are connected to one of eleven dataloggers located underground, and readings are collected by initiating the appropriate polling routine. Upon completion of a verification process, the data are transferred to a computer database. The manual reading devices are taken to the instrument locations underground, and the instruments are read by hand. The data are recorded on an appropriate data sheet and later entered into database files where they are combined with the remotely acquired readings.
The underground data acquisition system consists of instruments, polling devices, and a communications network. The polling devices are installed in underground local terminal cabinets (LTC) to query each individual instrument. The polling devices are connected by datalink cables and modems to the surface datalogging computer. Each polling device consists of a remote switching station and readout unit that is connected to the instruments throughout the facility. The surface datalogging computer utilizes a datalink cable and modem interface to receive the instrument readings from the polling units.
Whether acquired manually or remotely, geomechanical data are entered into the database files of the GIS data processing system. The processing system consists of programmed routines to enter, reduce, and transfer the instrumentation data to permanent storage files. Using dBase IV software, the datalogging and data processing routines are accessed by a personal computer located on the surface at the WIPP site. Additional routines allow access to these permanent storage files for tabular reporting and graphical plotting.
Data Evaluation
Closure measurements are acquired manually from convergence point anchors and remotely with convergence meters. The plots are presented as ground displacement monitored over time and plotted as either surface displacement or closure versus time.
Extensometers provide relative displacement data acquired from sensors installed in a borehole. The displacement is the measure of movement in the rock strata, intercepted by the extensometer borehole at various depths. The displacement is then compared to a fixed point providing a measured displacement relative to a fixed point.
Extensometers consist of rods that are anchored in a borehole at various depths. The deepest anchor is assumed to be fixed in undisturbed ground and is considered the reference point. Typically, the plots will show greater ground movement near the opening, i.e., the collar of the hole.
Rockbolt load cells are used to determine the bolt loading. Plots consist of load, in pounds, versus time for each instrumented bolt.
Earth pressure cells and strain gauges are used to determine the loads in and around the shaft liners and are depicted in time-based plots. Monitoring of these instruments indicates whether there is any stress buildup in the shaft lining systems.
Piezometers are used to measure the gauge pressure of ground water. They are installed in the shafts at varying elevations to monitor the hydraulic head acting on the shaft liners. Plots from piezometers are presented as pressure versus time.
Joint meters are installed perpendicular to a crack and monitor the displacement of the crack over time. Plots are presented as displacement versus time.
Other than the plotting functions discussed above, no analyses are performed directly through this systems. Individual analysts must extract the data manually, and process the data using stand-alone programs.
Geosciences Program
The Geosciences Program activities provide continuing confirmation of the suitability of the site through the collection of data on the geotechnical aspects of the underground facility, including documentation of the existing geology and monitoring of excavation characteristics. Geologic information is documented through mapping of excavation surfaces and logging of rock cores drilled from the excavations. Excavation characteristics (the rock mass structural responses to mining) are documented through fracture mapping and logging of fractures and offsets in open boreholes.
Borehole Data
Geotechnical observation boreholes are drilled at various locations throughout the underground facility. A location may contain one or several boreholes arranged in an array. These holes are inspected for fracturing and offsetting of strata surrounding the excavations and are typically drilled to depths that allow monitoring of rock behavior at one or more clay seams. Approximately 1000 holes and 10,000 subsurface features have been documented through the Geosciences Program.
Stratigraphic and Structural Maps
Continuing confirmation of WIPP facility horizon geology in areas of new mining is provided by geologic mapping of WIPP excavations in order to document the results of direct examination of rock lithology, stratigaphy, and structure. Fracture mapping is conducted to document the length, width, and orientation of fractures on excavation surfaces. To date, approximately 400 core logs, 200 excavation surface fracture maps, 250 stratigraphic maps and 1000's of photographs and videotapes have been generated in support of this program.
Between the geomechanical instrumentation and the geologic maps, there are literally hundreds of thousands of data points to be examined, both by WIPP personnel and be oversight and regulatory groups. While this vast quantity of information is extremely useful and necessary, it also presents a tremendous challenge to the analyst. The sheer size of the database makes data retrieval and systematic analyses of the data difficult. Therefore, a Geographic Information System was developed to make data handling simpler and more efficient.
GEOGRAPHIC INFORMATION SYSTEM
A GIS is a computer-based tool for spatially mapping and analyzing objects, conditions, and events on Earth. GIS technology integrates common database operations such as query and statistical analysis with the visualization and geographic analysis benefits offered by maps. These abilities distinguish GIS from other information systems and make it valuable to a wide range of public and private enterprises for explaining events, predicting outcomes, and planning strategies. GIS software runs on a wide range of hardware types, from centralized computer servers to desktop computers used in stand-alone or networked configurations. Key software components are:
The GIS used at WIPP depends on commercially available software packages, ArcView and ARC/INFO. ARC/INFO is a server application which generates the maps used to display and analyze the data. ArcView is a client applications which resides on the user's workstations. ArcView is used to display the data and generate reports. ArcView also provides an interface between the GIS software and other programs and applications which can use the data selected in ArcView. The connected applications include spreadsheet programs for data plotting, dBase programs for more complex analyses of the data, as well as C++ and Visual Pascal programs.
In 1995, Knight Piésold LLC, working under contract to Westinghouse Electric Corporation, developed a prototype of the Spatially-referenced Geotechnical Information System (SrGIS), which will replace the manual techniques described above. The system, now under final implementation, consists of ArcView 3, Visual dBase 5.5, Excel 5, and Delphi 2, all operating under Windows NT and Windows 95, and ARC/INFO 7.0.4, operating in UNIX (Figure 4). The system utilizes a network of Pentium PCs and a single Silicon Graphics Pro Indigo2 workstation. The system is designed to give engineers an integrated software solution to the data access, analysis, and display requirements at WIPP.
The preexisting software packages, dBase and Excel, were retained and incorporated into the SrGIS for two purposes: to provide stronger database and graphing capabilities than those provided within ArcView, and to make the most of the existing expertise present among the engineering staff in these software packages. The system's chief strengths are based on adding the spatial component to the system, tying the software packages together in a user-friendly fashion through Dynamic Data Exchange (DDE), and placing a common interface on top of these packages through forms and menus created in Delphi.
The SrGIS is designed to allow a user to identify instruments in the repository interactively, or through spatial query building, in ArcView. The attributes of these instruments are then studied or further refined in dBase, with information passing back and forth behind the scenes, through Windows-based DDE technology. Conversely, a tabular query performed in dBase is then displayed and further refined in ArcView. The results of the combined spatial and tabular query are then passed on to Excel, where they are charted and graphed. The resultant graphs are then passed back to ArcView, where they can be incorporated into a layout, and then printed. There are other adjunct software packages associated with SrGIS. For example, scanned images which are associated with instruments and underground boreholes (which are also mapped), are viewed not through ArcView's native image viewing software, but through Delphi DLLs designed especially for image retrieval. Metadata documentation is handled through a separate package, as are on-line documentation and help files.
The GIS system at WIPP greatly simplifies the effort required to analyze the large volume of data. Previously, if an analyst desired to examine data from a particular opening in the WIPP underground, the analyst had to consult several maps or search databases manually just to determine what instruments were there. Once the instruments were identified, the data had to be extracted using cumbersome database commands. Most analyses then required that the data be exported to some other program more appropriate for data reduction and presentation. With the GIS system, the analyst can simply point to the opening of interest on a graphical display. Only two or three mouse clicks are required to export the data to an attached analysis program or plotting routine.
Figures 1 to 4 illustrate the simplicity of using the WIPP GIS system. Figure 1 shows the standard GIS view of the underground facility, with a plan view on the left and directional views of the selected opening. These views show the instrumentation in the roof, floor, and each of the four walls, each in a separate window. The room that is shown in the directional views can be changed by simply clicking on the plan view. Figure 2 shows the selection of a group of instruments for analysis using a ordinary mouse window. After selecting instruments with the mouse or by query, a click of a button brings up the data for those instruments as shown in Figure 3. Here the data can be sorted or the selection can be further refined. Also from this screen, the analyst can select from a number of analysis and plotting programs that are directly linked to the GIS, or the analyst can send the data to an external program. Figure 4 shows an Excel plot of the data that was generated through the GIS. From instrument selection to the completion of analysis required only four mouse clicks, and all within the uniform GIS interface. Previously, this would require knowledge of the syntax of several languages and quite a bit more effort. In addition to the improved efficiency of expert data analysis, the data and analyses are now much more accessible to the non-expert user.
FUTURE PLANS
Several long term plans are being evaluated pertaining to the future of the GIS and instrumentation systems. One possiblity is the integration of the GIS system with the site intranet (local network) and perhaps the Internet. Intranet access would allow personnel on site to quickly access the data and examine the results of relatively simple analyses. Internet access would allow access for the general public and academia, as well as WIPP oversight and regulatory groups.
Another possible improvement to the system would be the integration of the actual data acquisition hardware with the GIS. This could allow the use of Areal-time@ data in the GIS. Theoretically, a user could ask the software to poll the dataloggers and update the data. This would make the latest data available to the analysts.
Commercial software currently exists that could in part or whole, transform the GIS system into a three dimensional visualization package. Such a system would allow the analysts to travel down the mine openings in a computer generated "virtual reality". It is even possible to overlay pictures of the excavation surfaces on the computer model, thus imparting an even great sense of reality.
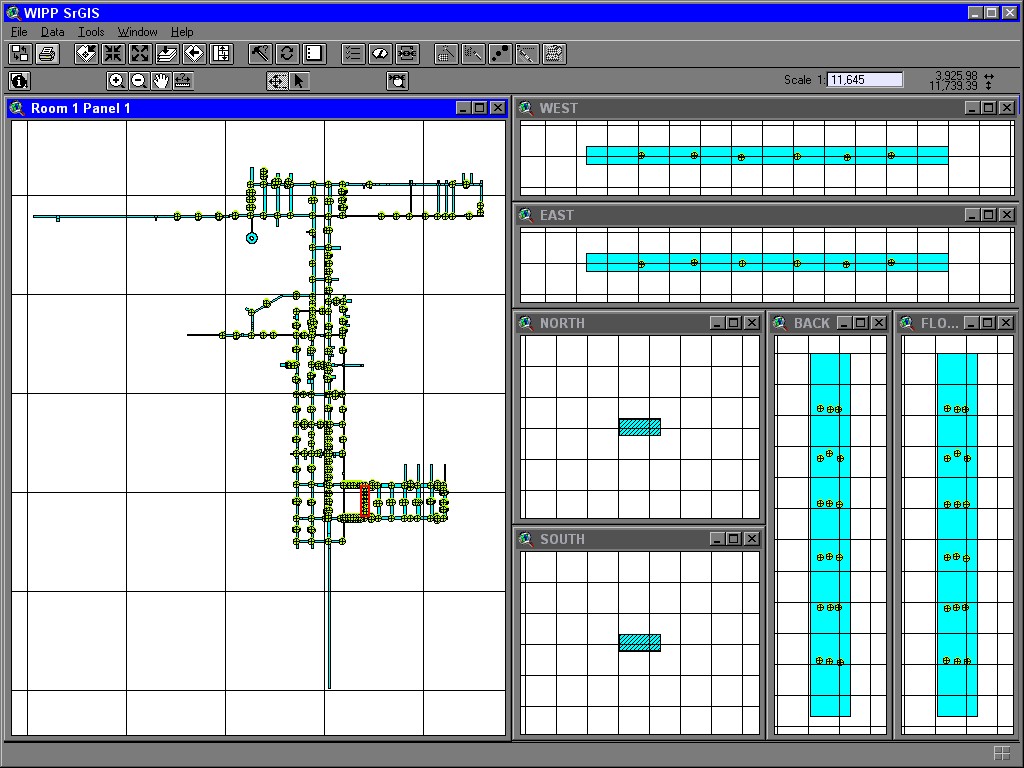
Fig. 1. The WIPP GIS Navigation Screen.
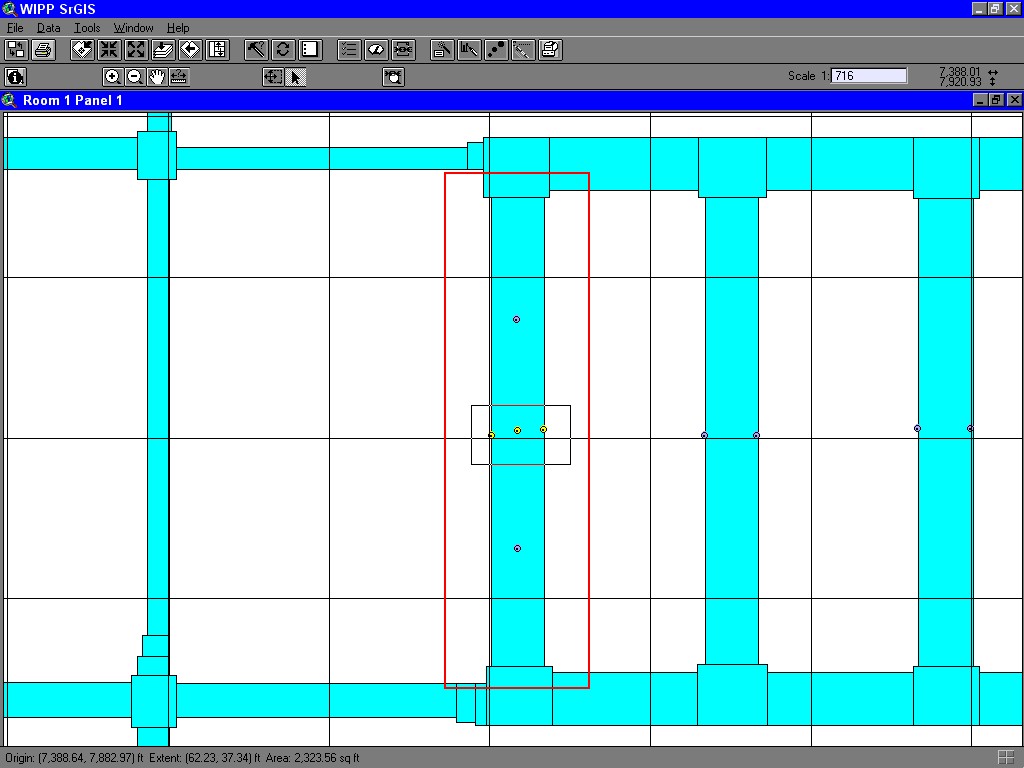
Fig. 2. Instrument Selection in the WIPP GIS.
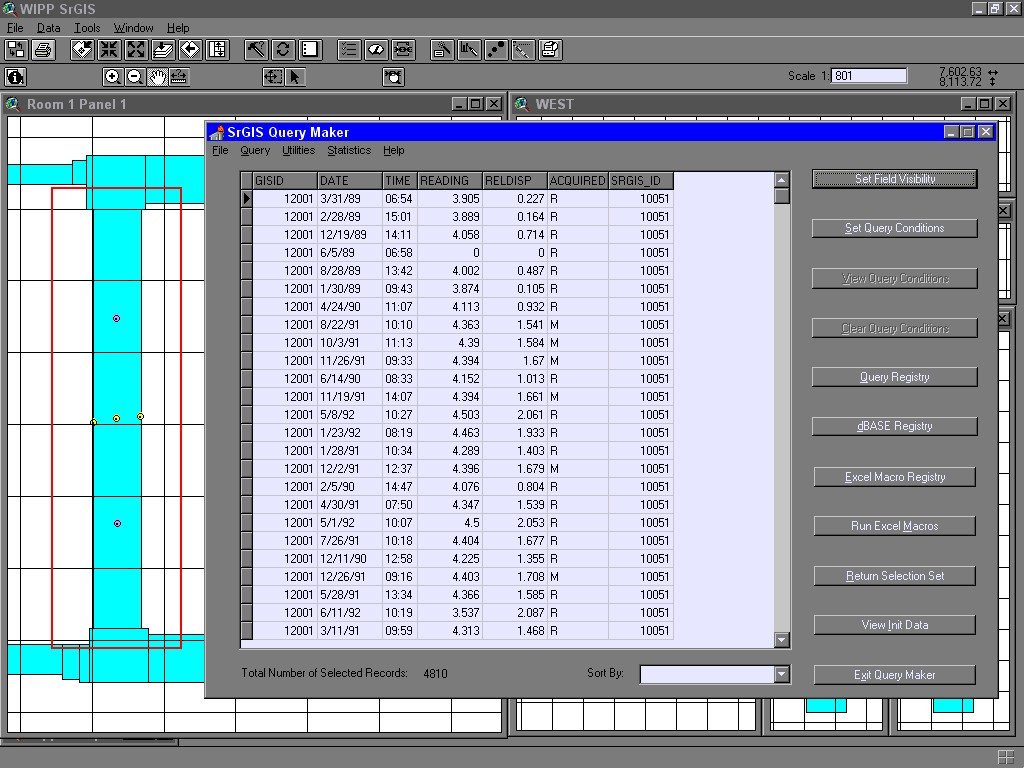
Fig. 3. Data Retrieval in the WIPP GIS.
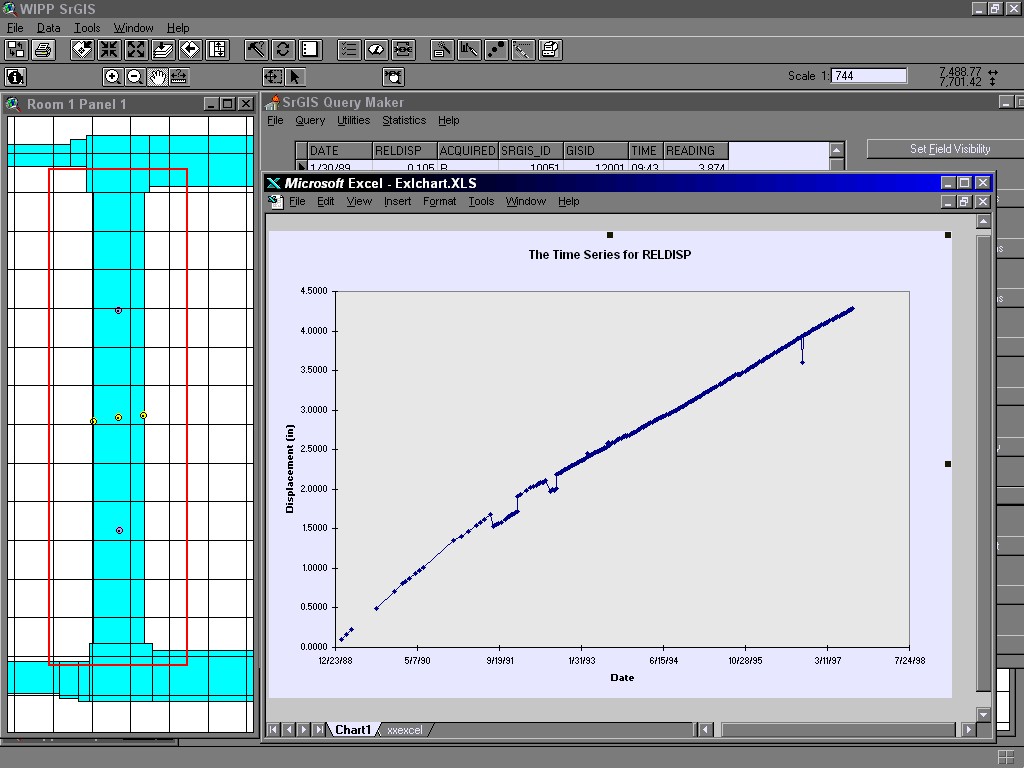
Fig. 4. Data Analysis in the WIPP GIS.
CONCLUSIONS
The addition of the GIS system has improved data retrieval and analysis in a variety of ways. The chief improvement is in the graphical user interface inherent in the GIS system. This allows project personnel to select data geographically. That is, the user can select an area of the repository graphically using standard windowing tools and the GIS can report what data is available in that area. Previously, personnel had to memorize or consult large databases in order to determine what data was available. The new GIS also simplifies data retrieval and analysis. The user can now simply click on a graphical display of the mine and the data for the instruments or the geological maps for that area are displayed. The data can then easily be analyzed using pre-defined analysis macros in the GIS or it can be sent to another program.
The combined GMP/GIS system at WIPP has proven successful. In addition to the benefits for technical users outlined above, the new system has the potential to allow easy data access for non-technical personnel. Such a system could be integrated into a World Wide Web site which other professionals or interested stakeholders could use to get relatively up to date information on this or other projects.
Document Number DOE/WIPP Draft-2242
Processing and final preparation of this report were performed by the Westinghouse Electric Corporation's Waste Isolation Division, the management and operating contractor for the Waste Isolation Pilot Plant, under U.S. Department of Energy contract DE-AC04-86AL31950.