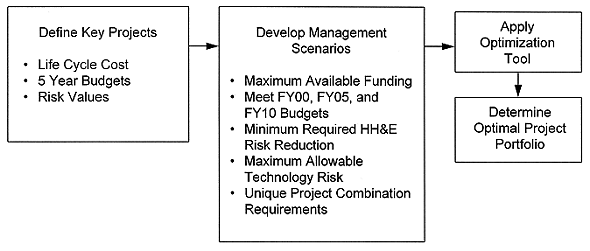
Fig. 1. Technical approach to select
optimal DOE project portfolios.
Kenneth S. Redus
MACTEC
189 Lafayette Drive, Suite
C
Oak Ridge, TN 37830
Ph: (423) 483-2715 Fax (423) 483-2717
Scott E. State
MACTEC
1419 Denver West Drive, Suite
400
Golden, CO 80401
Ph: (303) 278-3100 Fax (303) 273-5000
ABSTRACT
Results in optimal project selection are demonstrated using U. S. Department of Energy 1996 Baseline Environmental Management Report strategic requirements. This paper describes how to select an optimal portfolio of multiple Waste Management, Environmental Restoration, Nuclear Material and Facility Stabilization, and landlord activity projects. An optimal portfolio of projects minimizes total Life Cycle Cost while meeting constraints in the areas of annual funding levels and risk management. Although this approach presented in this paper is not currently used by DOE, optimal project portfolios are proven in the commercial and financial sectors, and the portfolios provide rigorous and efficient allocation of fiscal resources.
INTRODUCTION
The U. S. Department of Energy (DOE) is committed to successfully demonstrate and complete multiple, complex, and costly Waste Management (WM), Environmental Restoration (ER), Nuclear Material and Facility Stabilization (NM&FS), and landlord activity projects as documented in the Baseline Environmental Management Report (BEMR) (1).
In fact, DOE proposes to remediate 80% of all DOE sites by 2021 by moving to a project-based approach. This paper develops optimal DOE project portfolios by examining 32 high cost projects that account for $67.9B of an estimated $227B to be spent through 2070.
Previous work (2,3,4) has demonstrated that an optimal project portfolio can be determined that minimizes total Life Cycle Cost (LCC) while both maximizing total human health and environmental (HH&E) risk reduction and minimizing total technological risk. By considering multiple combinations of project parameters, optimal project portfolios are determined by examination of hundreds of candidate projects with several thousands of cost, risk, and project combination constraints. Mixed integer programming, a common operations research optimization tool, is used to accomplish this. The approach to determine optimal DOE project portfolios is presented in Fig. 1.
Fig. 1. Technical approach to select
optimal DOE project portfolios.
WHAT IS AN OPTIMAL DOE PROJECT PORTFOLIO?
An optimal DOE project portfolio is similar to an optimal mutual fund portfolio. A mutual fund portfolio consists of a set of marketable instruments that provide some rate of return. These instruments come from a universe of many investment opportunities. The objective of an optimal mutual fund portfolio is to 1) minimize total cost, 2) maximize the rate of return, and 3) maintain an acceptable level of risk.
An optimal DOE project portfolio is one in which the total cost (discounted or current year dollars) of all funded projects is minimized. The funded projects come from a universe of many projects that can, in some way or another, support DOE mission accomplishment. An optimal DOE project portfolio must also ensure that project costs do not exceed selected fiscal year (FY) budgets. Such a portfolio maximizes human health and environmental risk reduction. It also maximizes the probability that technological solutions will be successful. An optimal DOE project portfolio is therefore an efficient project portfolio. Projects which do not support mission accomplishment are not funded.
One unique aspect of optimal DOE project portfolios, however, is captured in the term "project combination constraints." Such combinations represent a form of fairness for project selection, but this certainly creates inefficiencies. Some projects must be funded, or continue to be funded, regardless of their efficiency. Some projects, for whatever reason, will not be selected regardless of their potential. Other projects are such that if one project is selected for funding, a competing project is not funded. Similarly, some projects exhibit a dependency, or an enabling, aspect. This means that if a particular project is funded, then one, or more, other projects must also be selected for funding.
Summarizing, therefore, an optimal DOE project portfolio must meet the following criteria:
Management scenarios are used to define unique constraints associated with each portfolio. For example, 1) a desired maximum LCC is specified which cannot be exceeded, 2) expected upper bounds on FY budgets are defined,3) desired risk bounds are indicated, or 4) specific project combination constraints may be defined. These scenarios explicitly consider uncertain futures in budgets or risk management requirements.
Optimal project portfolios are determined for each management scenario. A best course of action chooses projects that exhibit 1) the greatest slack in LCC cost, FY budgets, and schedule, and 2) the greatest marginal increase in risk reduction or risk minimization.
METHOD TO DETERMINE OPTIMAL DOE PROJECT PORTFOLIOS
Optimal project portfolios were developed using project life cycle cost and fiscal year estimates contained in the 1996 BEMR, illustrative values of human health and environmental risk reduction and technological risk, and representative project combination constraints. The intent was to clearly demonstrate -- using a real world situation -- that optimal project portfolios, while common in the commercial and financial sectors, can be used to support DOE projects in terms of efficient allocation of scarce fiscal resources.
Four different types of projects were evaluated: 1) waste management; 2) environmental restoration (to include decommissioning, remedial action, treatment, storage, or disposal); 3) nuclear material and facility stabilization; and, 4) landlord activities. Science and technology and national program planning and management projects were not examined.
Tables I and II summarize the 32 DOE projects examined. These projects account for $67.9B of an estimated total $227B to be spent through 2070. The projects were used to demonstrate how optimal project portfolios could be developed. All cost and project information was obtained from the 1996 BEMR: the ten highest-cost WM projects (Table 4.4), eight high-cost ER projects (Table 4.5), the ten highest-cost NM&FS projects (Table 4.6), and four landlord activities (Section 4.3.5).
The projects are at numerous DOE sites: 1) Hanford Site, 2) Idaho National Engineering Laboratory, 3) Savannah River Site, 4) Waste Isolation Pilot Plant, 5) West Valley Demonstration Project (WVDP), 5) Nevada Test Site (NTS), 6) Rocky Flats Environmental Technology Site (RFETS), 7) Oak Ridge Y-12 Plant, 8) Portsmouth (Port), 9) Sandia National Laboratory New Mexico, 10) Lawrence Livermore National Laboratory (LLNL), and 11) Oak Ridge K-25 Site.
Table I. DOE Projects Summarized by LCC ($M) and Number of Projects
(n)

Table II. DOE Projects Described by Site, Type, and LCC ($M)
OPTIMAL DOE PROJECT PORTFOLIO THAT SUPPORT THE 1996 BEMR
Optimal project portfolios are determined from 32 DOE projects. The portfolios are WM, ER, NM&FS, and Landlord projects that minimize total LCC, maximize human health and environmental risk reduction for ER, NM&FS, and Landlord activities, and minimize technical risk for WM projects. The selected projects must also meet maximum allowable FY budget constraints for FY00, FY05, and FY10. Furthermore, the optimal set of projects must meet project selection constraints that require specific projects to be selected.
LCC values are obtained directly from 1996 BEMR. Risk values are illustrative in nature and are not intended to reflect actual risk values associated with each project. WM risk is defined the as the technical risk. Human health and environmental risk reduction is used to measure the success of ER, NM&FS, and Landlord projects. Project combination constraints are also illustrative. For all scenarios, projects 2, 6, 11, 19, 26, and 29 through 32 must be funded.
A base case and five management scenarios are used to identify and compare portfolios:
The minimum LCC for optimal project portfolios is presented in Table III for each management scenario. Several observations are provided:
Table III. Minimum Life Cycle Costs ($M) for Optimal DOE Project
Portfolios

Table IV identifies projects that are contained in each optimal portfolio for all management scenarios including the base case. While the funding and risk constraints are different for Scenarios 1, 2, and 3, the optimal LCC are almost identical. In fact, examining which projects are not funded (Hanford T-Plant WM, and Portsmouth and SNL ER) reveals the impact these projects have on constraint attainment. Compare Scenario 4 and Scenario 5. Observe that decreasing WM funding and relaxing technical risk is driven by two WM projects: INEL Chemical Processing and SRS Defense Waste Processing. These two projects alone account for a $8,400M reduction in LCC.
A graphical comparison of the Base Case with management Scenario 2 is presented. The minimum LCC are presented for each project category as a comparison to the Base Case in Fig. 1. The total slack, namely the difference between the Base Case and the optimal projects is presented in Fig. 2. Either portrayal provides an graphical assessment of the scenario impact. Cost savings in WM projects are clearly demonstrated.
Using the results of the illustrative example, a numerical comparison may be performed to examine optimal Waste Management projects and LCC for the Base Case and for Scenario 3. There is a significant decrease in annual and total LCC for the optimal portfolio, or equivalently, when the Hanford High-Level and Low-Level Vitrification Facility and the Hanford T-Plant projects are not funded. The primary reason for not including these projects in the optimal project portfolio is the cost of the projects. Savings resulting from not funding (or equivalently, discontinuing funding) these two projects reduces the expected LCC from $45,700M to $29,200M and reduces the estimated completion from FY70 to FY50.
Table VI. Identification of Optimal Project Portfolios

Fig. 2. Minimum Life Cycle Costs ($M)
For Scenario 2 Full Funding For All Projects, At Most 15% Technical Risk For WM
Projects, At Least 85% Risk Reduction For ER, NM&FS, and Landlord Projects

Fig. 3. Optimal Slack ($M) For
Scenario 2 Full Funding For All Projects, At Most 15% Technical Risk For WM
Projects, At Least 85% Risk Reduction For ER, NM&FS, and Landlord Projects
CONCLUSIONS
Integer programming has been shown as a reasonable approach to identify optimal project portfolios that minimize total LCC and meet annual budget constraints, technical risk requirements, human health and environmental risk reduction requirements, and multiple project combinations has been presented. Scenarios based on annual funding levels, desired risk values, and project cost factors have been examined. The technical basis for this approach has been well documented (2-5).
Optimal portfolios of WM, ER, NM&FS, and Landlord projects have been identified from 32 DOE projects documented in the 1996 BEMR. The portfolios 1) minimize total LCC, 2) minimize technical risk for WM projects, 3) maximize human health and environmental risk reduction for ER, NM&FS, and Landlord projects, 4) meet maximum allowable budget constraints for FY00, FY05, and FY10, and 5) meet unique project selection constraints that require specific projects to be selected.
The optimization tool is fully automated. It offers the DOE the ability to immediately identify, select, and evaluate optimal project portfolios to meet DOE 10-Year and total life cycle planning challenges, engender and maintain public support, and define the allocation of projects for privatization or DOE accomplishment.
REFERENCES