Table I Environmental and population data used to group disposal
sites in terms of population risk vulnerability (1)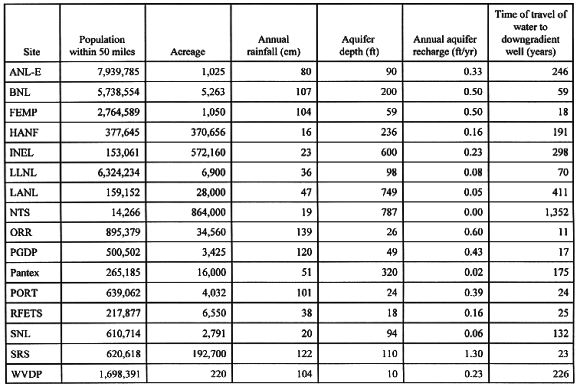
Philip Sczerzenie
META, Inc., Gaithersburg MD
Lou Borghi
SAIC, Inc. Germantown MD
Peter Siebach
EM-30
ABSTRACT
Statistical analyses of site environmental variables were conducted to enable the Department of Energy to compare alternative management strategies for low-level mixed waste and low-level waste disposal in terms of their relative potential for offsite population risk. Factor analysis of 16 candidate disposal sites used data on six site characteristics likely to be associated with future offsite population risk from waste disposal--annual rainfall, annual groundwater recharge, aquifer depth, travel time of water from the time it infiltrates the ground surface to the time it reaches the aquifer and appears in a well 300m downgradient, current human populations within 50 miles of the site center, and site acreage. Sites were depicted graphically according to their scores on two factors that explained 79 percent of the variability in the site data-- a site groundwater hydrology factor and a population/acreage factor. Cluster analysis of the site data and overlay of the clusters on the factor diagram enabled DOE to assign each of the 16 sites to one of three groups with relatively higher, intermediate, or lower potential for offsite population risk from disposal. The population risk vulnerability (PRV) groups developed in these analyses are used in the Waste Management Programmatic Environmental Impact Statement (WM PEIS) for comparison of decentralized, regionalized, and centralized alternative disposal strategies. Alternatives are displayed in WM PEIS tables that identify for each site that would dispose under an alternative, the waste volume and curie load projected to be disposed and the site's PRV group. Summary tables display for each alternative the total waste volume and curie load for sites within each PRV group.
INTRODUCTION
Although maximally-exposed individual (MEI) and population (or collective) risk estimation are both routinely used to characterize the potential health consequences of Federal agency actions, certain considerations led DOE to conclude that an alternative to collective risk estimation was needed for the Waste Management Programmatic Environmental Impact Statement (WM PEIS) comparison of disposal alternatives.
First, other DOE efforts to address disposal risk do not generally estimate population risk. DOE has been addressing the issue of protecting the public from the effects of exposures to radioactive and mixed waste constituents released from disposal facilities. Ongoing Department efforts include performance assessments conducted for LLW disposal facilities in compliance with the requirements of DOE Order 5820.2A(DOE 1988) and performance evaluations conducted for candidate LLMW disposal sites by the FFCAct Disposal Workgroup. Although these efforts currently address risks to single individuals at specified compliance points, none attempts to predict collective risks to current or future populations.
Second, DOE determined that estimation of offsite population risk from exposure to disposal facility contaminants in the WM PEIS would require too many speculative assumptions and would not provide a credible basis for comparison of LLMW or LLW disposal alternatives. The concentrations of contaminants in the groundwater and the number of people potentially exposed will be determined in large part by the locations of the disposal units and the receptor wells. Estimation of the number of adverse health effects in current offsite populations would require information about the exact locations of the disposal facilities on sites. Since the WM PEIS does not attempt to make such siting decisions, offsite population doses (i.e., person-rem) and risks (e.g., number of latent cancer fatalities) from disposal were not estimated. Analysis of future offsite population risks requires similar siting information and involves additional uncertainty with respect to the sizes of future populations. Therefore, the WM PEIS could not credibly estimate adverse health impacts from disposal for future offsite populations.
Therefore, an alternative analysis methodology was needed for the WM PEIS that would characterize the LLMW and LLW disposal alternatives using relevant information about the sites but that would not require quantitative estimates of collective dose and risk. This paper describes the statistical methodology and data DOE selected to characterize the population risk vulnerability of the proposed disposal sites and to compare the disposal alternatives. The disposal alternative comparisons are presented in Chapters 6 and 7 of the WM PEIS.
SUMMARY OF ANALYTICAL METHODS
The methodology consisted of a factor analysis to identify the principal axes of variability of the site environmental data and relate those factors to population risk vulnerability and a cluster analysis to identify distinct groups of sites on those principal axes.
Factor Analysis
Factor analysis is a statistical technique that can be used to identify a relatively small number of factors to represent relationships among a set of many interrelated variables (Norusis/SPSS Inc., 1993). The factors are derived to explain the observed correlations among the interrelated variables. The more highly correlated the original set of observations (cases) on the variables, the fewer factors are required to describe the relationships--that is, the more of the total variability in the data set can be represented by the first few derived factors. If the variables are completely uncorrelated, factor analysis will not provide a more compact explanatory solution than the original variable set. A good factor solution is also interpretable. The factors can be interpreted as revealing underlying attributes of the variable set that can be readily described in broad terms.
Norusis/SPSS Inc. (1993) describe a four-step procedure for factor analysis:
In step 1, the interrelatedness of the variables is determined by examination of the simple Pearson correlation coefficients and some simple statistical tests of the correlation matrix to determine if a factor analysis is an appropriate technique to apply to the data set. In step 2, factors are extracted, usually initially using principal components extraction, in which linear combinations of the variables are derived. These principal component vectors account in sequence for decreasing portions of the data variability and are independent of one another (orthogonal). The principal components may then be interpreted by the analyst as identifying a general underlying measure of the variables. In step 3, the initial factor solution is rotated to produce factors that are easier to interpret. In step 4, the factor scores for each case are computed by multiplying the original variable set by the principal components or rotated factors. These factor scores can be plotted to show how the different cases relate to each other in factor-space.
Cluster Analysis
Cluster analysis is a statistical technique used to identify relatively homogeneous subgroups or clusters from data on members of a larger population. Members of these subgroups can then be considered to share common characteristics and to be relatively distinct from other subgroups in terms of the important measured variables used to determine the clusters (Nurisis/SPSS, Inc, 1993). Cluster analysis establishes groupings based on distance/nearness calculations for a set of specified variables. In the most commonly applied calculation method, clusters are derived using squared Euclidean distances.
ANALYSIS OF POPULATION RISK VULNERABILITY OF WM DISPOSAL SITES
Selection and Transformation of Explanatory Variables
The variables chosen to be used in the factor and cluster analyses of the 16 candidate disposal sites were six site characteristics considered likely to cause, or be strongly associated with, future levels of offsite population risk from radioactive or mixed waste disposal: annual rainfall, annual groundwater recharge, aquifer depth, travel time of water from the time it infiltrates the ground surface to the time it reaches the aquifer and appears in a downgradient well, current human populations within 50 miles of the site, and site acreage (Table I). The first three variables, which characterize the surface and groundwater hydrology of the sites, are measures known to determine the speed, duration, and extent of dispersal of contaminants from disposal facilities and the level of resulting downgradient concentrations in groundwater. The travel time estimates are based on the physical properties of the soils, the aquifer depth, and the groundwater velocity at each site. Current population levels are considered the most appropriate measure of the potential size of the population at risk in the near term, at least on a relative basis from site to site. Site acreage provides an indirect measure of two associated characteristics--the size of the potential populations at risk and the likelihood that contaminants in downgradient groundwater would appear in a publicly accessible well water source; the former because the larger sites exclude population growth on extensive areas, the latter because of the relationship between the proximity of offsite population centers to locations on the sites where disposal facilities would be constructed. Data on annual rainfall, aquifer depth, current human populations within 50 miles of the site, and site acreage were taken from ORNL (1995). Estimates of time of travel were made using environmental setting data on unsaturated and saturated soil zones for the 16 disposal sites provided in ORNL (1995). Data on annual groundwater recharge was taken from SNL (1996). These site characteristics are generally strongly correlated with each other--for example, the smaller sites tend to be situated in regions of denser population with higher rainfall. Therefore, it was expected that the seven variable measures could be represented by a limited number of principal factors that are composite measures of the important variations in the site characteristics.
Table I Environmental and population data used to group disposal
sites in terms of population risk vulnerability (1)
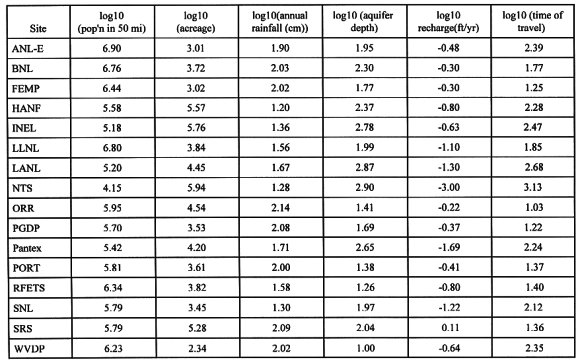
Examination of the variable distributions showed that they were not normally distributed so log transformations were performed to create a more linearized, normally distributed data set (Table II). This transformation ensures a fairer application of the statistical general linear model and, among other benefits, minimizes the tendency for larger measures to be unduly weighted in the factor solutions and cluster extractions.
Table II Transformed environmental and population data used to
categorize disposal sites for population risk vulnerability.
FACTOR ANALYSIS OF ENVIRONMENTAL VARIABLES
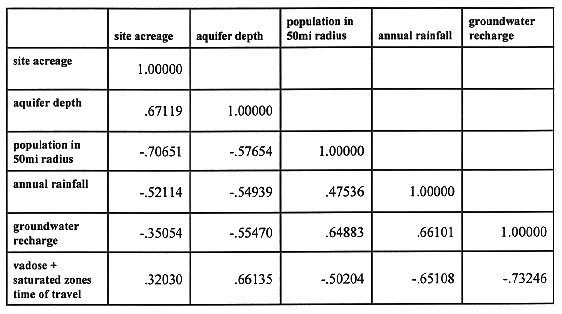
Correlation Matrix Computation and Appropriateness of the Fact or Model
Simple correlations among the transformed environmental variables were computed (Table III). Measures of the appropriateness of the factor model were computed, including Bartlett's test of sphericity, the Kaiser-Meyer-Olkin (K-M-O) overall measure of sampling adequacy, and individual measures of sampling adequacy. Bartlett's test gave a value of 50.61 with a significance of .00001 indicating that it is highly unlikely that the variables are uncorrelated. The K-M-O value of .64851 indicates that correlations between pairs of variables can be adequately explained by the other variables. The substantial degree of correlation shown between variables and the results of the appropriateness tests indicated that factor analysis would be a fruitful technique for investigation of the data.
Table III Correlation Matrix of Transformed Environmental Variables
FACTOR EXTRACTION
The first principal component derived in the analysis (Table IV) accounts for approximately 64 percent of the variability, or information content, in the site environmental characteristics data. It is a vector that substantially measures all seven variables--the absolute values of the loadings exceed 0.5 for all variables. It can be interpreted as accounting for the fact that the smaller sites are generally the sites with higher regional populations and with wetter hydrologic conditions. These conditions include higher rainfall, a generally shallow water table, and a relatively short groundwater time of travel. The second principal component accounts for an additional 15 percent of the data variability, but is not as readily interpretable. (The sites are plotted according to their scores on the first two principal components in Fig. 1.) Therefore, factor rotation was performed in an attempt to derive factors that could be more satisfactorily interpreted.
Table IV First two principal components of site environmental
variables and rotated factors derived from oblique rotation of the principal
components.
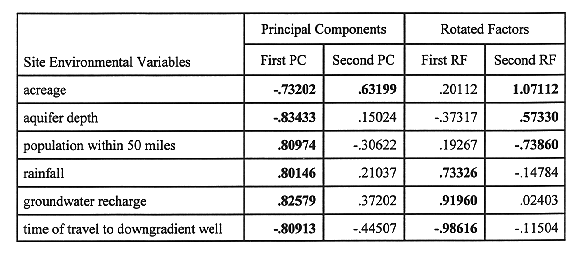
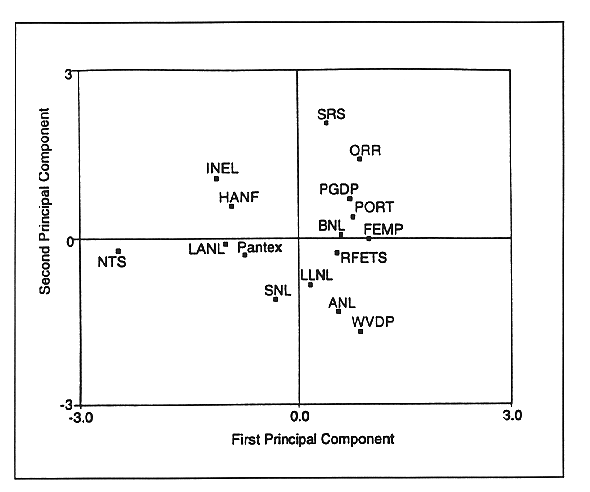
Fig. 1. Sites plotted according to
their scores on the first two principal components of the environmental data.
FACTOR ROTATION
The factor rotation technique selected for the analysis, oblique rotation, produces more easily interpretable factors in this instance although the factors are not independent. The first two oblique factors (Table IV) can be interpreted as (1) a site hydrology factor that is positively loaded on rainfall and groundwater recharge and negatively loaded on time of travel of water to a downgradient well, and (2) a general site characteristics factor that might be described as the "small, shallow water table, high population" factor. The factors have a correlation of -.58603 ; sites that have higher scores on oblique factor 1 tend to have lower scores on oblique factor 2.
OBLIQUE FACTOR SCORES
Sites are plotted according to their scores on the first two oblique factors in Fig. 2. To provide a more understandable presentation of the rotated factors, the site scores on the second oblique factor were reversed (multiplied by negative 1) before being plotted in the oblique factor diagram. Sites to the right in the diagram have higher scores on the first factor indicating they have groundwater hydrologic conditions that would tend to move contaminants more quickly downgradient from disposal units and possibly to drinking water wells that might be used by the public. Sites to the left in the diagram are those where site hydrology tends to limit migration of contaminants and increase the time over which any movement might result in well water contamination. In terms of scores on the second factor, sites plotted in the upper portion of the diagram are those that are smaller in size with higher surrounding populations. Those plotted lower are the larger sites with lower surrounding populations. Land uses on and near the sites, the site size itself, and the size of the surrounding populations are more likely to change substantially during the time contaminants may be leaching from disposal units than the physical characteristics of the site. Therefore, DOE considers the first factor scores more important than the second factor scores in characterizing the sites' relative potential for offsite population risk.
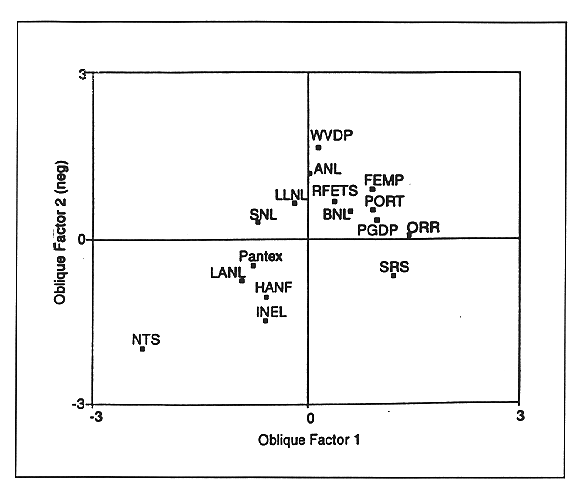
Fig. 2. Sites plotted according to
their scores on the first two oblique factors of the environmental data.
Derivation of Population Risk Vulnerability Clusters
The factor analysis gives a general indication of the population risk vulnerability relationships of the 16 proposed disposal sites. The factor scores of the 16 sites show relationships among the sites in hydrologic and population characteristics that would be reasonable to conclude would be directly related to the levels of population dose and risk. However, to identify distinct groups of sites representing similar levels of potential for population risk from waste disposal, the sites were grouped using a cluster analysis of the same six site characteristics. A dendrogram (Fig. 3) illustrates the partitioning of the sites into an increasing number of clusters based on the squared-Euclidean distance method applied to the standardized variables. The first five clusters derived were used in the population risk vulnerability analysis. The first cluster developed, reading the diagram from right to left, splits off Hanford, INEL, LANL, Pantex, and NTS from the remaining 11 sites. The next extraction splits NTS (Cluster 4) from Hanford, INEL, LANL, and Pantex (Cluster 3). A third extraction separates WVDP (Cluster 5) from the remaining 11 sites and a fourth extraction divides FEMP, ORR, PGDP, PORTS, and SRS (Cluster 2) from ANL, BNL, LLNL, RFETS, and SNL (Cluster 1). Sites are arrayed by their cluster number in Fig. 4.
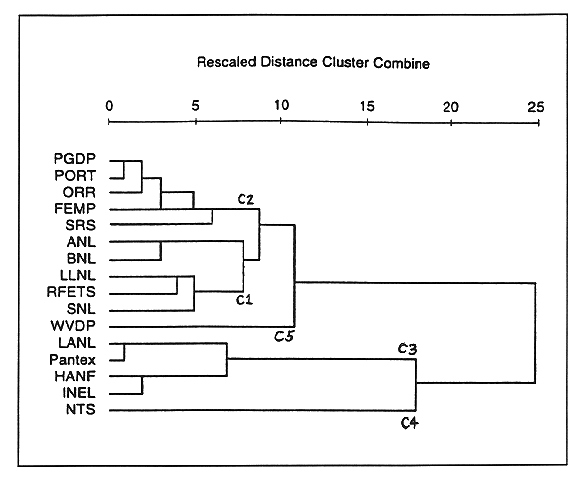
Fig. 3. Dendrogram illustrating
derivation of site clusters from environmental data.
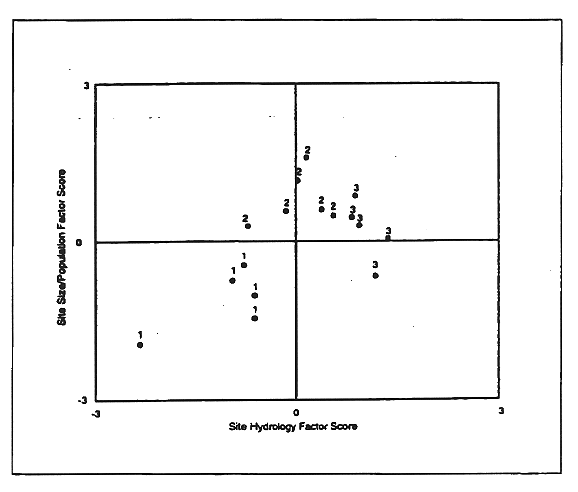
Fig. 4. Sites arrayed by cluster
number according their scores on the first two oblique factors of the
environmental data.
The cluster analysis was used to identify three general site groups according to their expected relative population risk vulnerability. The single-site clusters (4 and 5) were combined with their nearest neighbor clusters. The resulting groups were renumbered to indicate higher (PRV Group 3), intermediate (PRV Group 2), and lower (PRV Group 1) relative population risk vulnerability. The groups are listed with the basis of the PRV grouping in Table 5.
Table VI. Interpretation of Site Clusters in Terms of Relative
Potential for
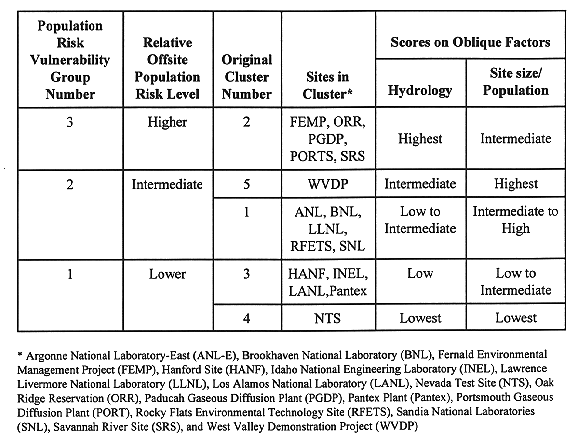
OFFSITE POPULATION RISK FROM DISPOSAL
Comparison of LLMW and LLW Alternatives by Population Risk Vulnerability
The LLMW and LLW disposal alternatives were arrayed in terms of greater or lesser potential for population risk based on the cluster designation of the sites proposed for disposal under each alternative and the waste volume, curie load, and number of disposal units required at those sites. LLMW and LLW alternatives were then summarized in terms of the total waste volume, curie load, and number of disposal units required at all sites within each population risk cluster. Those alternatives with greater volume, curie load, and number of disposal units at group 3 sites could generally be considered to represent a relatively greater risk to populations than alternatives that concentrate disposed wastes at group 1 and 2 sites. From a population risk perspective, alternatives that concentrate disposed wastes at group 1 sites would represent the lowest risk.
REFERENCES